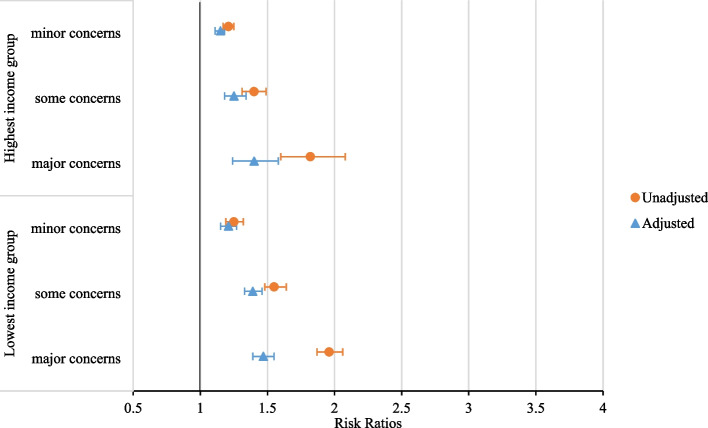
Fig. 1.
Associations of perceived income inadequacy with chronic disease, for highest and lowest income quartile in unadjusted and fully adjusted models. Lowest income group: 0%-25% household income percentile, highest income group: 75%-100% household income percentile. Unadjusted models only include absolute income and perceived income inadequacy. The adjusted model includes age, sex, marital status, migration background, highest completed level of education, mastery, absolute income quartile and perceived income inadequacy. Analyses are based on weighted, multiple-imputed data

