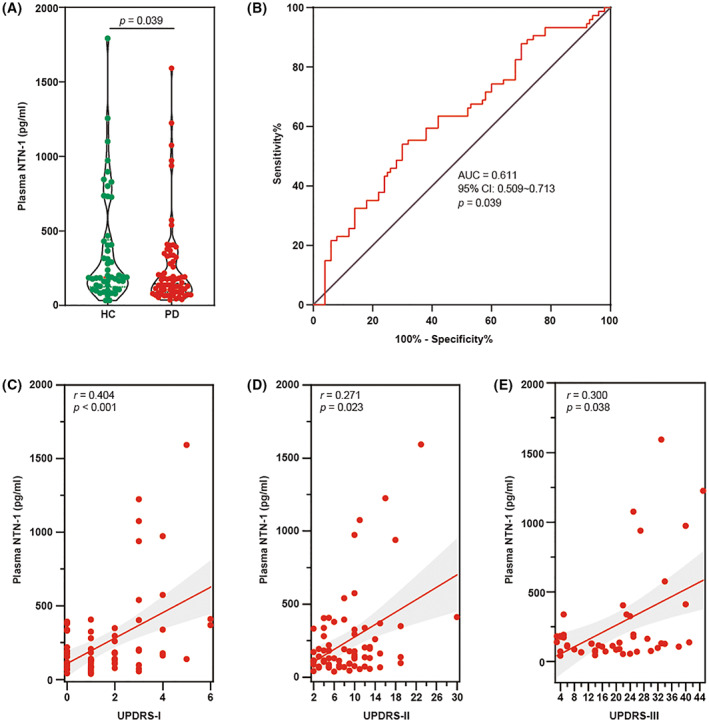
FIGURE 6.

Plasma NTN‐1 level and its correlation with UPDRS score in PD patients. (A) Scatter diagram of plasma NTN‐1 levels between the HC and PD groups. Data were presented as dot plots in each group and analyzed by Mann–Whitney test. (B) ROC curves of plasma NTN‐1 levels for distinguishing PD patients from HC. The whiskers in the box plots indicate the values from minimum to maximum, and the center line indicates the median. (C) Relationship between plasma NTN‐1 levels and UPDRS I among PD patients. (D) Relationship between plasma NTN‐1 levels and UPDRS II among PD patients. (E) Relationship between plasma NTN‐1 levels and UPDRS III among PD patients. AUC, area under the ROC curve; HC, healthy control; NTN‐1, netrin‐1; PD, Parkinson's disease; UPDRS, Unified Parkinson disease rating scale.
