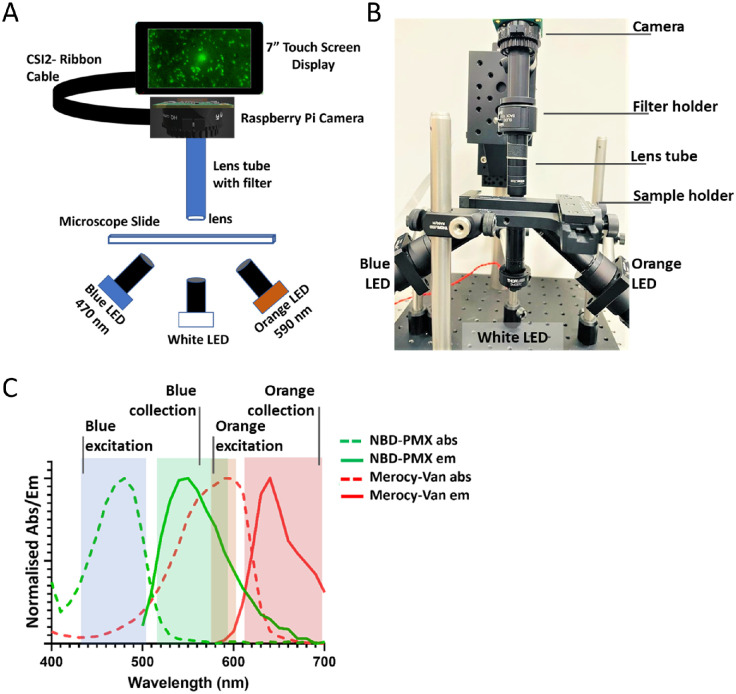
Figure 1.
(A) Schematic of the fluorescence imaging setup (FluoroPi). (B) Photograph of the FluoroPi system. (C) Excitation (dashed lines) and emission (solid lines) spectra of SmartProbes: NBD-PMX (green) and Merocy-Van (red). Solid-color blocks show the FluoroPi blue and orange LEDs and associated emission filter band widths for fluorescence excitation and collection.

