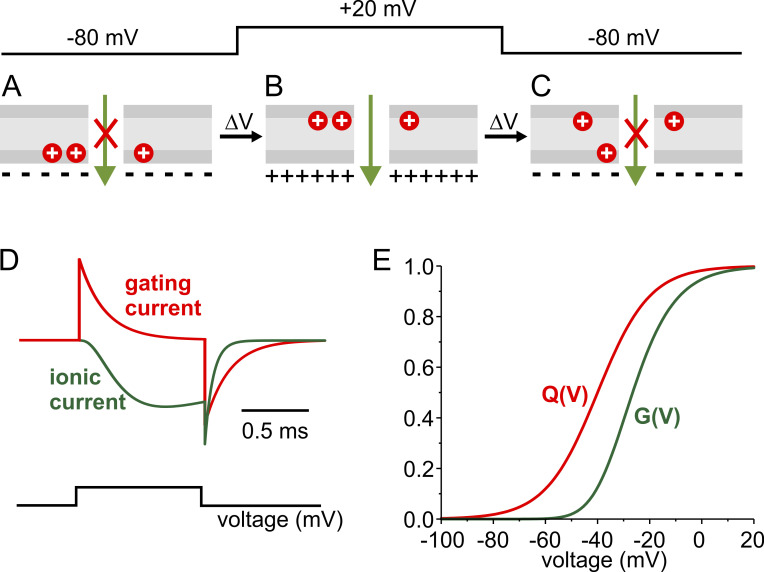
Figure 1.
Hodgkin and Huxley’s charged gating particles. (A–C) Sketch illustrating the membrane relocation of the three-activating charged gating particles of Na channel upon membrane depolarization and repolarization. (D) Time courses of gating particles’ translocation (red trace) and Na currents (green trace) obtained using Eqs. 5 and 6 of Box 1 for the activation phase, and Eqs. 7 and 8 for the deactivation phase, respectively, considering three activation particles and one inactivation particle. (E) Theoretical voltage dependence of charged gating particles translocation, Q(V), and channel conductance, G(V), for a voltage-gated ion channel, obtained using Eqs. 9 and 10 of Box 1, respectively.

