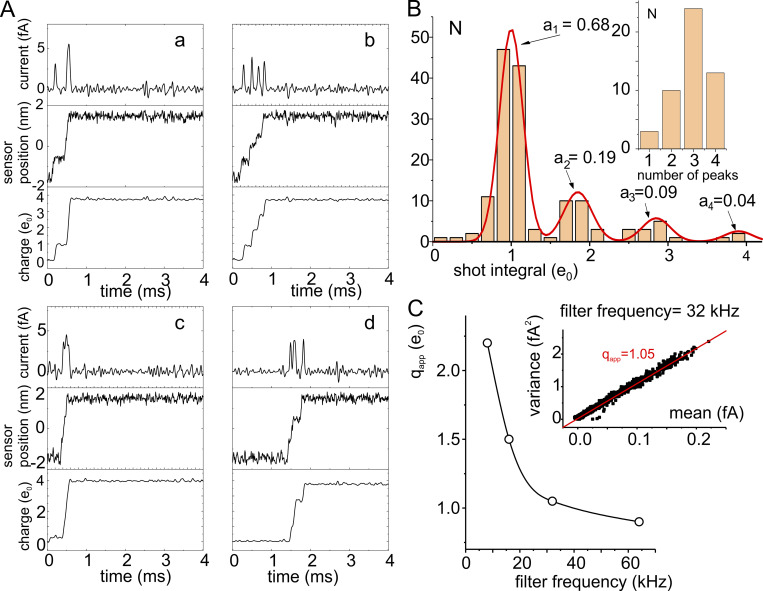
Figure 7.
Evidence for multicharge steps from a Brownian model of gating. (A) Representative simulations upon pulsing to +10 mV (from a holding voltage of −110 mV), showing varying numbers of current peaks (a–d, top). For each simulation also shown are the voltage sensor movement and the charge transported. (B) Bar histogram of the number of events (N) carrying the indicated charge quantity (e0). Inset: Number of responses (N) with 1–4 peaks. (C) Dependence of qapp on the cutoff filter frequency. Data were obtained from Brownian simulated variance vs. mean current plots. The plot shown in the inset was obtained at a frequency of 32 kHz (from Catacuzzeno et al., 2021a).

