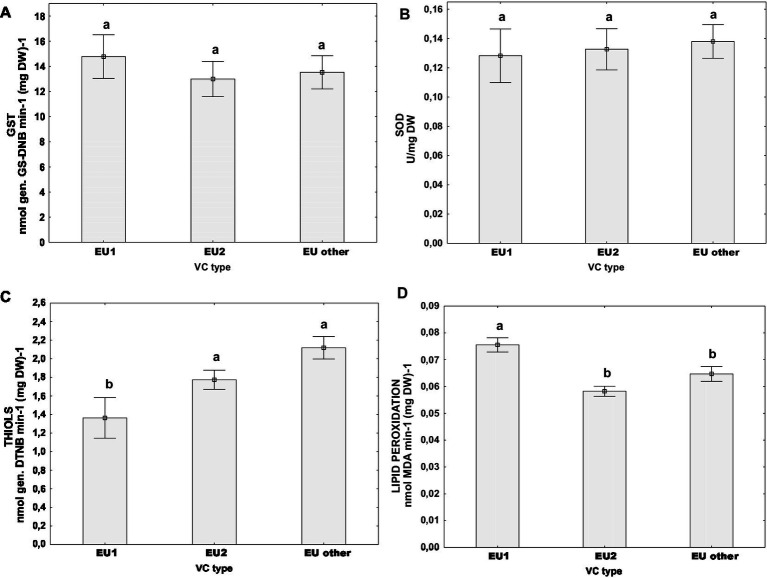
Figure 4.
Difference of oxidative stress parameters for populations naturally infected with CHV1 grouped by vc types (EU-1, EU-2, “EU-other”): (A) activity of GST, (B) activity of SOD, (C) content of non-proteins thiols, and (D) level of lipid peroxidation. Data are represented as mean ± SE. Letters denote the statistical difference between vc type groups (Tukey HSD), at p < 0.05.

