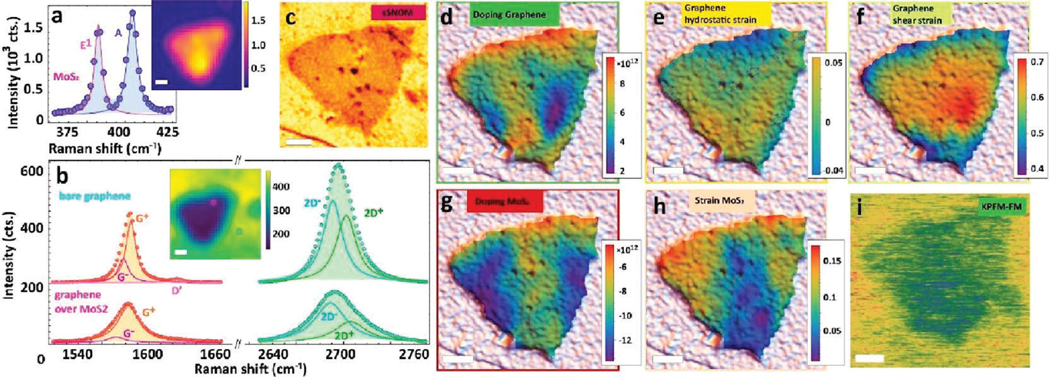
Figure 17.
Multidimensional imaging on /graphene. (a) Raman spectrum, fitted with E1 and A-bands, (inset) A-band intensity map; (b) Raman spectra for graphene off/on island, fitted by G (orange), (pink) and 2D (green) bands, (inset) Raman map of 2D-amplitude showing the island location; (c) KPFM (a) KPFM image; (d—f) calculated graphene doping, hydrostatic and shear strain maps, overlaid with scanning electron microscopy image; (g, h) doping and strain for layer overlaid with SEM image; (i) sSNOM phase image of the same area. All scale bars are 1 μm. Reproduced with permission from ref 329. Copyright 2022 American Chemical Society.

