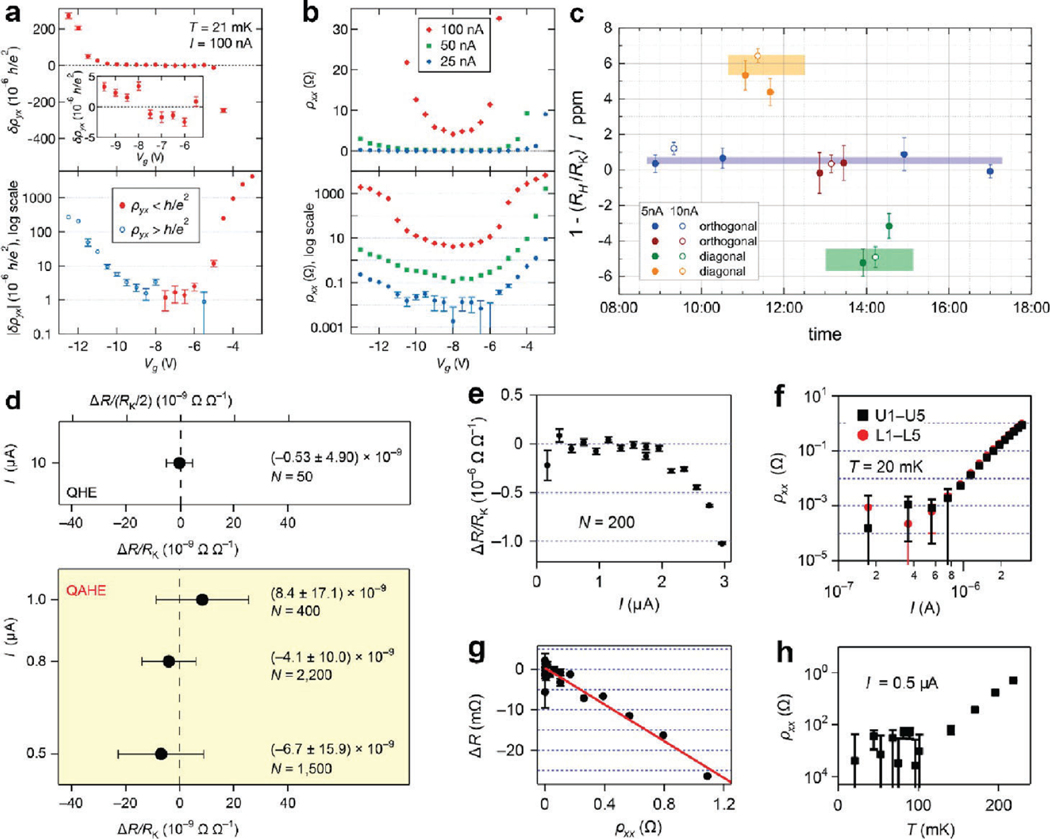
Figure 22.
Summary of QAHE measurements of MTI-based films. (a) Cryogenic current comparator data are shown for Hall measurements in an example device using a 100 nA current at 21 mK. The plateau in the upper panel shows the deviation from . The inset shows a magnified view of the Hall resistance deviations in the center of the plateau . The bottom panel shows the logarithmic behavior of the deviations as one departs from the optimal gate voltage. (b) The longitudinal resistivity for the same device. Data are displayed on a linear and log scale in the top and bottom panels, respectively. All error bars show the standard uncertainty and are omitted when they are smaller than the data point. Reproduced with permission from ref 424. Copyright 2018 by the American Physical Society. (c) Topological insulator at the plateau data. Currents of 5 and 10 nA were used in both orthogonal and diagonal configurations. The colored rectangles represent the weighted average and standard deviation of the data from those configurations. Reproduced from ref 422 with the permission of AIP Publishing. (d—h) Quantization accuracy of the QAHE-based resistance standard. (d) The normalized deviation are shown (top panel shows conventional quantum Hall effect). The error bars correspond to the combined standard uncertainty and denotes the number of data points used for averaging. (e) The dependence of on the source-drain current (I) is shown, with the error bars corresponding to the standard deviation of measurements. (f) The current dependence of the longitudinal resistance is shown at a temperature of 20 mK. The longitudinal resistivity was measured by using the upper (U1—U5) and lower (L1—L5) pairs of voltage contacts. The error bars are the standard deviation of measurements. (g) The relationship between and shown with a red line as the linear fitting result. (h) Temperature dependence of measured at using the upper pair of voltage contacts (U1—U5). The error bars are the standard deviation of measurements. Reproduced with permission from ref 423. Copyright 2022 Springer Nature.

