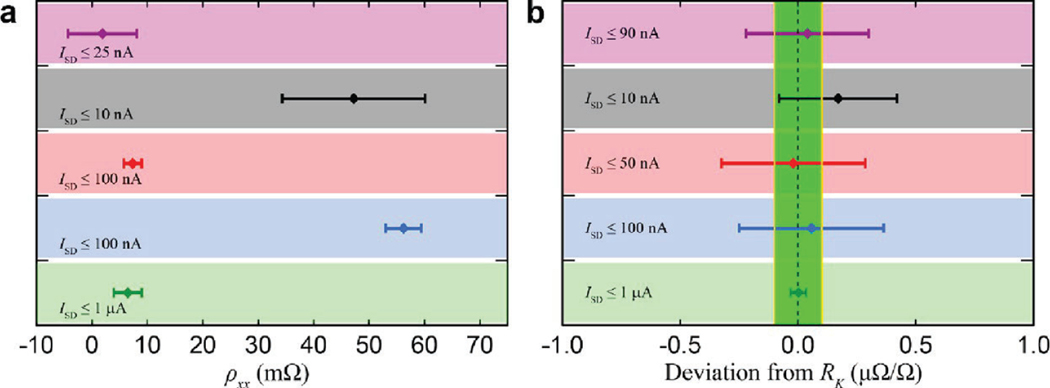
Figure 23.
Summary of the precision measurements of (a) and (b) the QAHE over the previous few years. Applied currents vary, and the following MTI measurements are represented: 2018 NIST/Stanford (purple),424 PTB/UW (black),422 2022 NIST/Stanford (red and blue),427 and 2022 NMIJ and partners (olive).423 The light green region in panel (b) marks the boundary for data points going beneath one part in 107. All error bars represent type A and B combined uncertainties. Adapted with permission under Creative Commons Attribution 4.0 International license from ref 427. Copyright 2022 American Physical Society.

