Table 1.
Comparison of Coronaviruses
| Disease | Flu
|
SARS
|
MERS
|
COVID-19
|
|---|---|---|---|---|
| Pathogen | Influenza virus | SARS-CoV | MERS-CoV | SARS-CoV-2 |
| Country of origin | Worldwide | China | Saudi Arabia | Wuhan, China |
| First outbreak | 1918 | 2003 | 2012 | 2019 |
| Type of the virus | RNA | RNA | RNA | RNA |
| Pathogen origin (zoonotic) | Avian, Swine, etc. | Bats, Civet | Bats, Camel | Bats |
| Incubation in days | 1–4 | 2–7 | 6 | 4–14 |
| Community attack rate | 10–20% | 10–60% | 4–13% | 30–40% |
| Hospitalization rate | 2% | Most cases | Most cases | ~19% |
| Fatality rate | 0.05–0.01% | 9.6–11% | 34.40% | ~3.40% |
| Total deaths (WHO) | 12,000–61,000 annually | 916 | 858 | Ongoing |
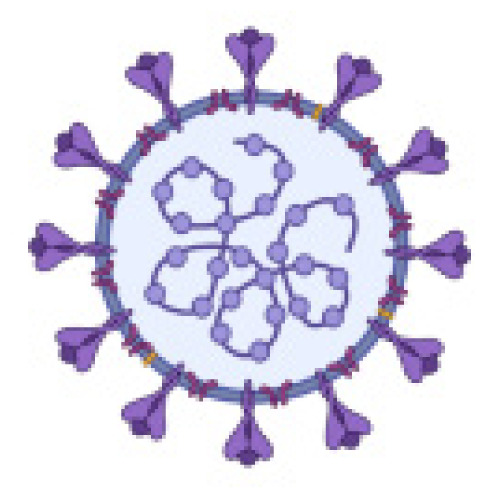
Created using BioRender.com Credit: Keswani S. Department of Internal Medicine, MountainView Hospital.
