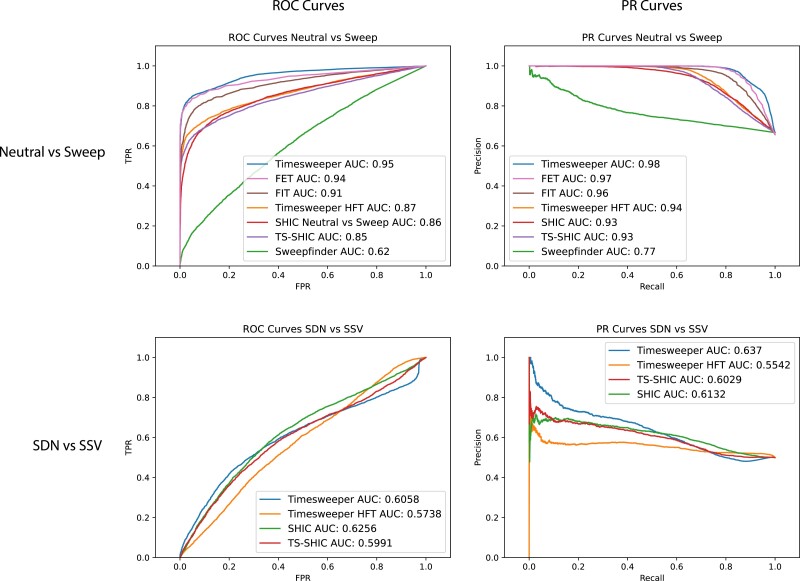
Fig. 3.
ROC and PR curves comparing the performance of Timesweeper to that of competing methods on the sweep detection task. The top row shows performance on the binary task of discriminating between simulated test data with and without selective sweeps, with the sweep class containing equal numbers of SDN and SSV examples. The bottom row shows performance on distinguishing between SDN and SSV examples in the test set.

