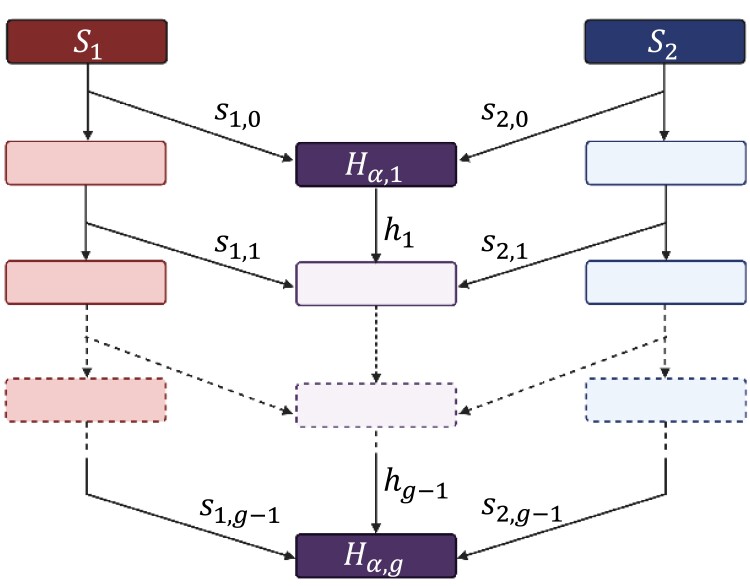
Fig. 2.
Schematic of the admixture model. Source populations and contribute to an admixed population H. The members of H in generation g draw parents from the populations of generation from with probability , from H with probability , and from with probability . Two parents are drawn independently. Random variable denotes the random autosomal ancestry fraction from population α (1 for , 2 for ) in an individual in population H in generation g.

