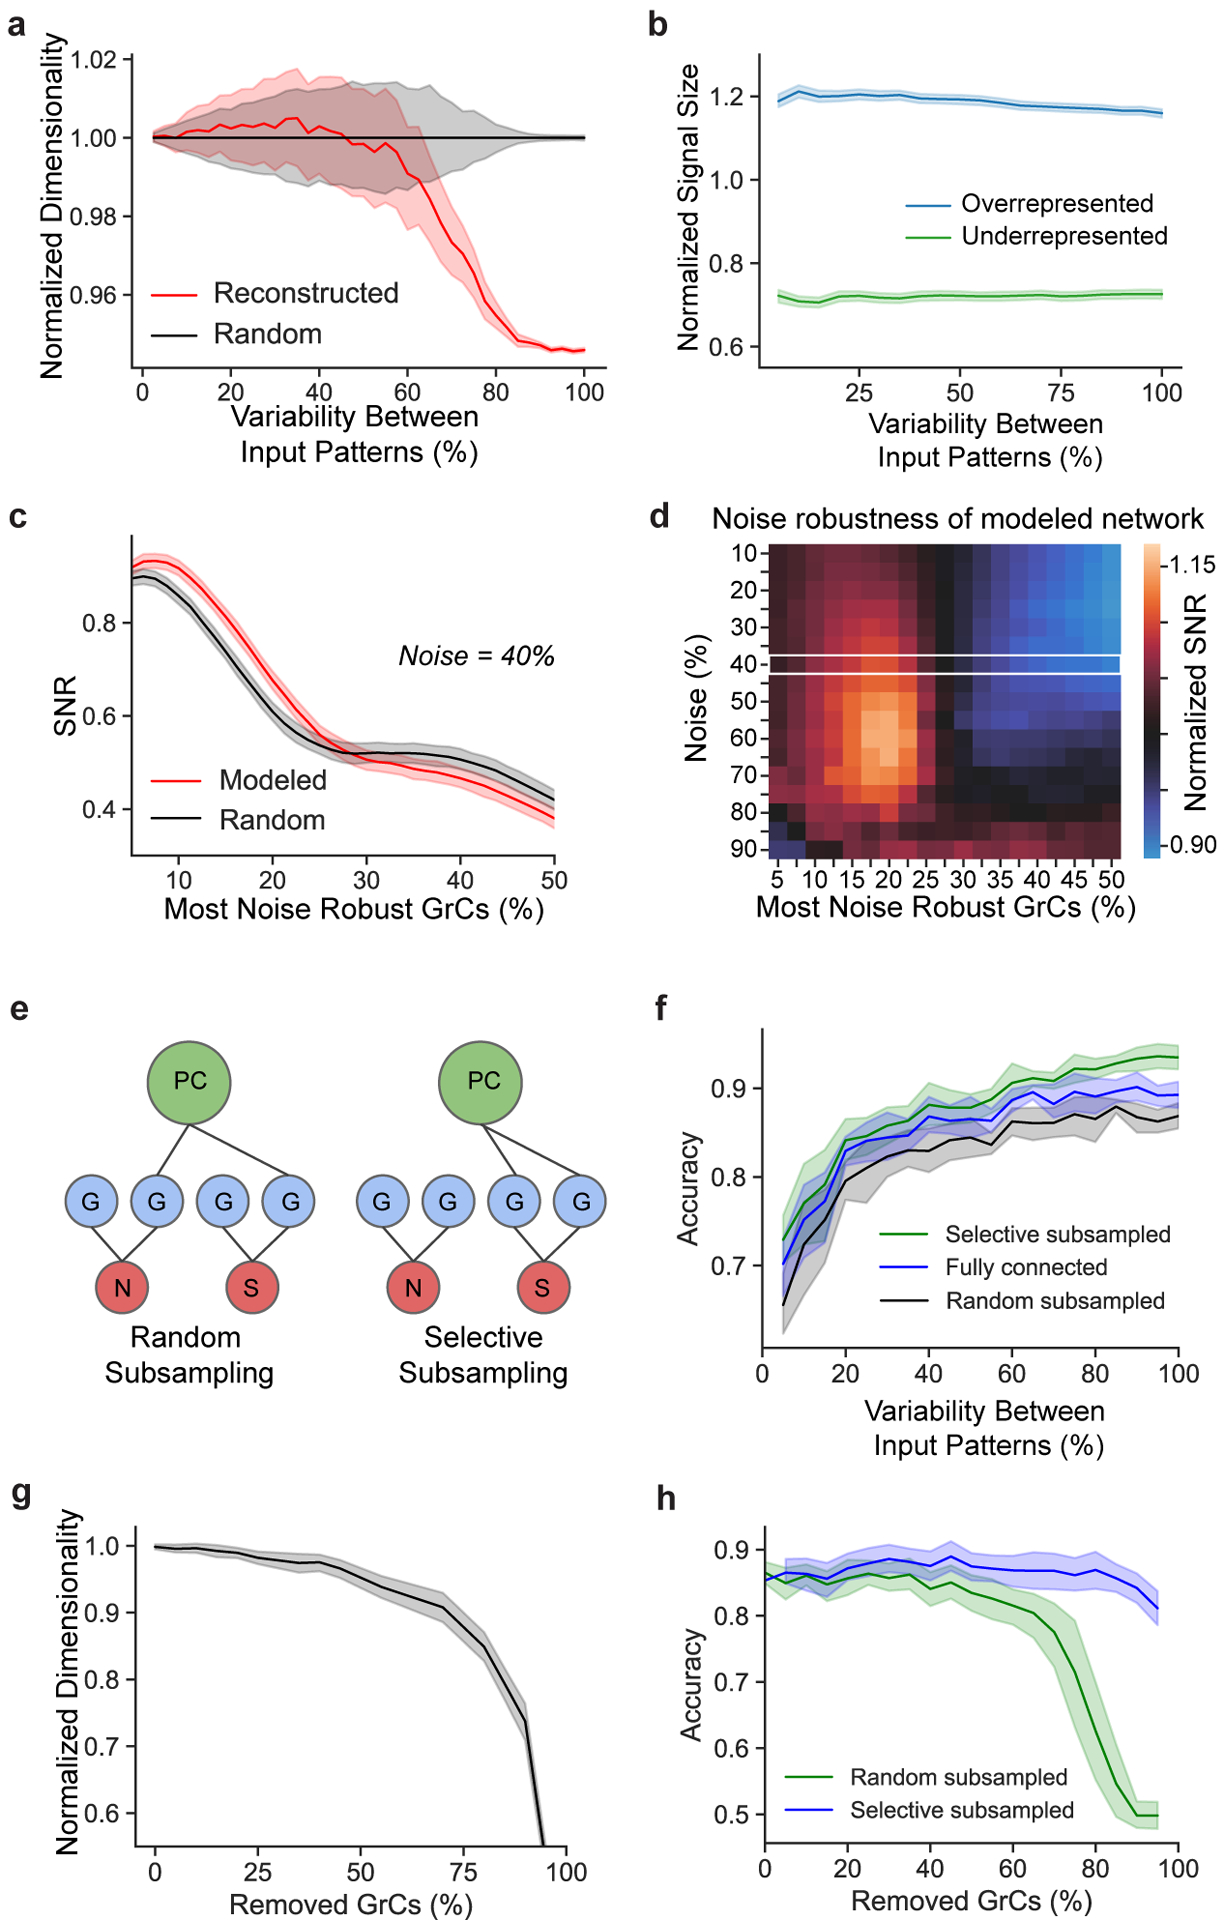
Extended Data Figure 9. MF-GrC-PC simulations.

a, Normalized dimensionality of GrCs as a function of input variability using a continuous model of spike frequency13. Noise was modeled as the degree of variation of spiking frequency across all MF inputs (Methods). b, Modeled learned signal size (Methods) as a function of variability between MF input patterns, comparing pattern separation performance between overrepresented (top-third most connected) and underrepresented (bottom-third) MF boutons. Signal size from the reconstructed network is normalized by the random connectivity model for each population separately. c-d, SNR analyses of modeled MF-GrC networks, measuring noise robustness with (Modeled) or without (Random) redundant oversharing of MF inputs (Fig. 2c,d). SNR was computed across GrC subpopulations ranked by robustness (Methods) at a 40% noise level in c, and across GrC subpopulations and noise levels in d (normalized to SNRs of the “random” model at each noise level and subpopulation). The white box in d denotes the noise level shown in c. Redundant oversharing helps PCs learn more reliably by encoding the most robust signals in a subset of more correlated GrCs. e, Binary GrC→PC selective subsampling increases SNR. Left: PCs (green) randomly subsample GrCs (blue) with MF (red) inputs containing signal (S) or noise (N). Right: PCs connect to GrCs encoding signal-relevant MFs, leading to a higher SNR (Fig. 4d). f, Prediction accuracy of a linear neural network trained on output patterns of the GrCs as a function of MF input variability, comparing performance of MF-GrC networks between models that were fully connected, randomly subsampled with 50% connectivity, and selective subsampled with 50% connectivity, all as a function of MF input variability. g, Dimensionality of the GrC population as a function of the percentage of GrCs randomly removed, normalized to the dimensionality with 100% of the population. h, Prediction accuracy as in f comparing performance of MF-GrC networks between randomly and selectively subsampled models as a function of a percentage of randomly removed GrCs.
