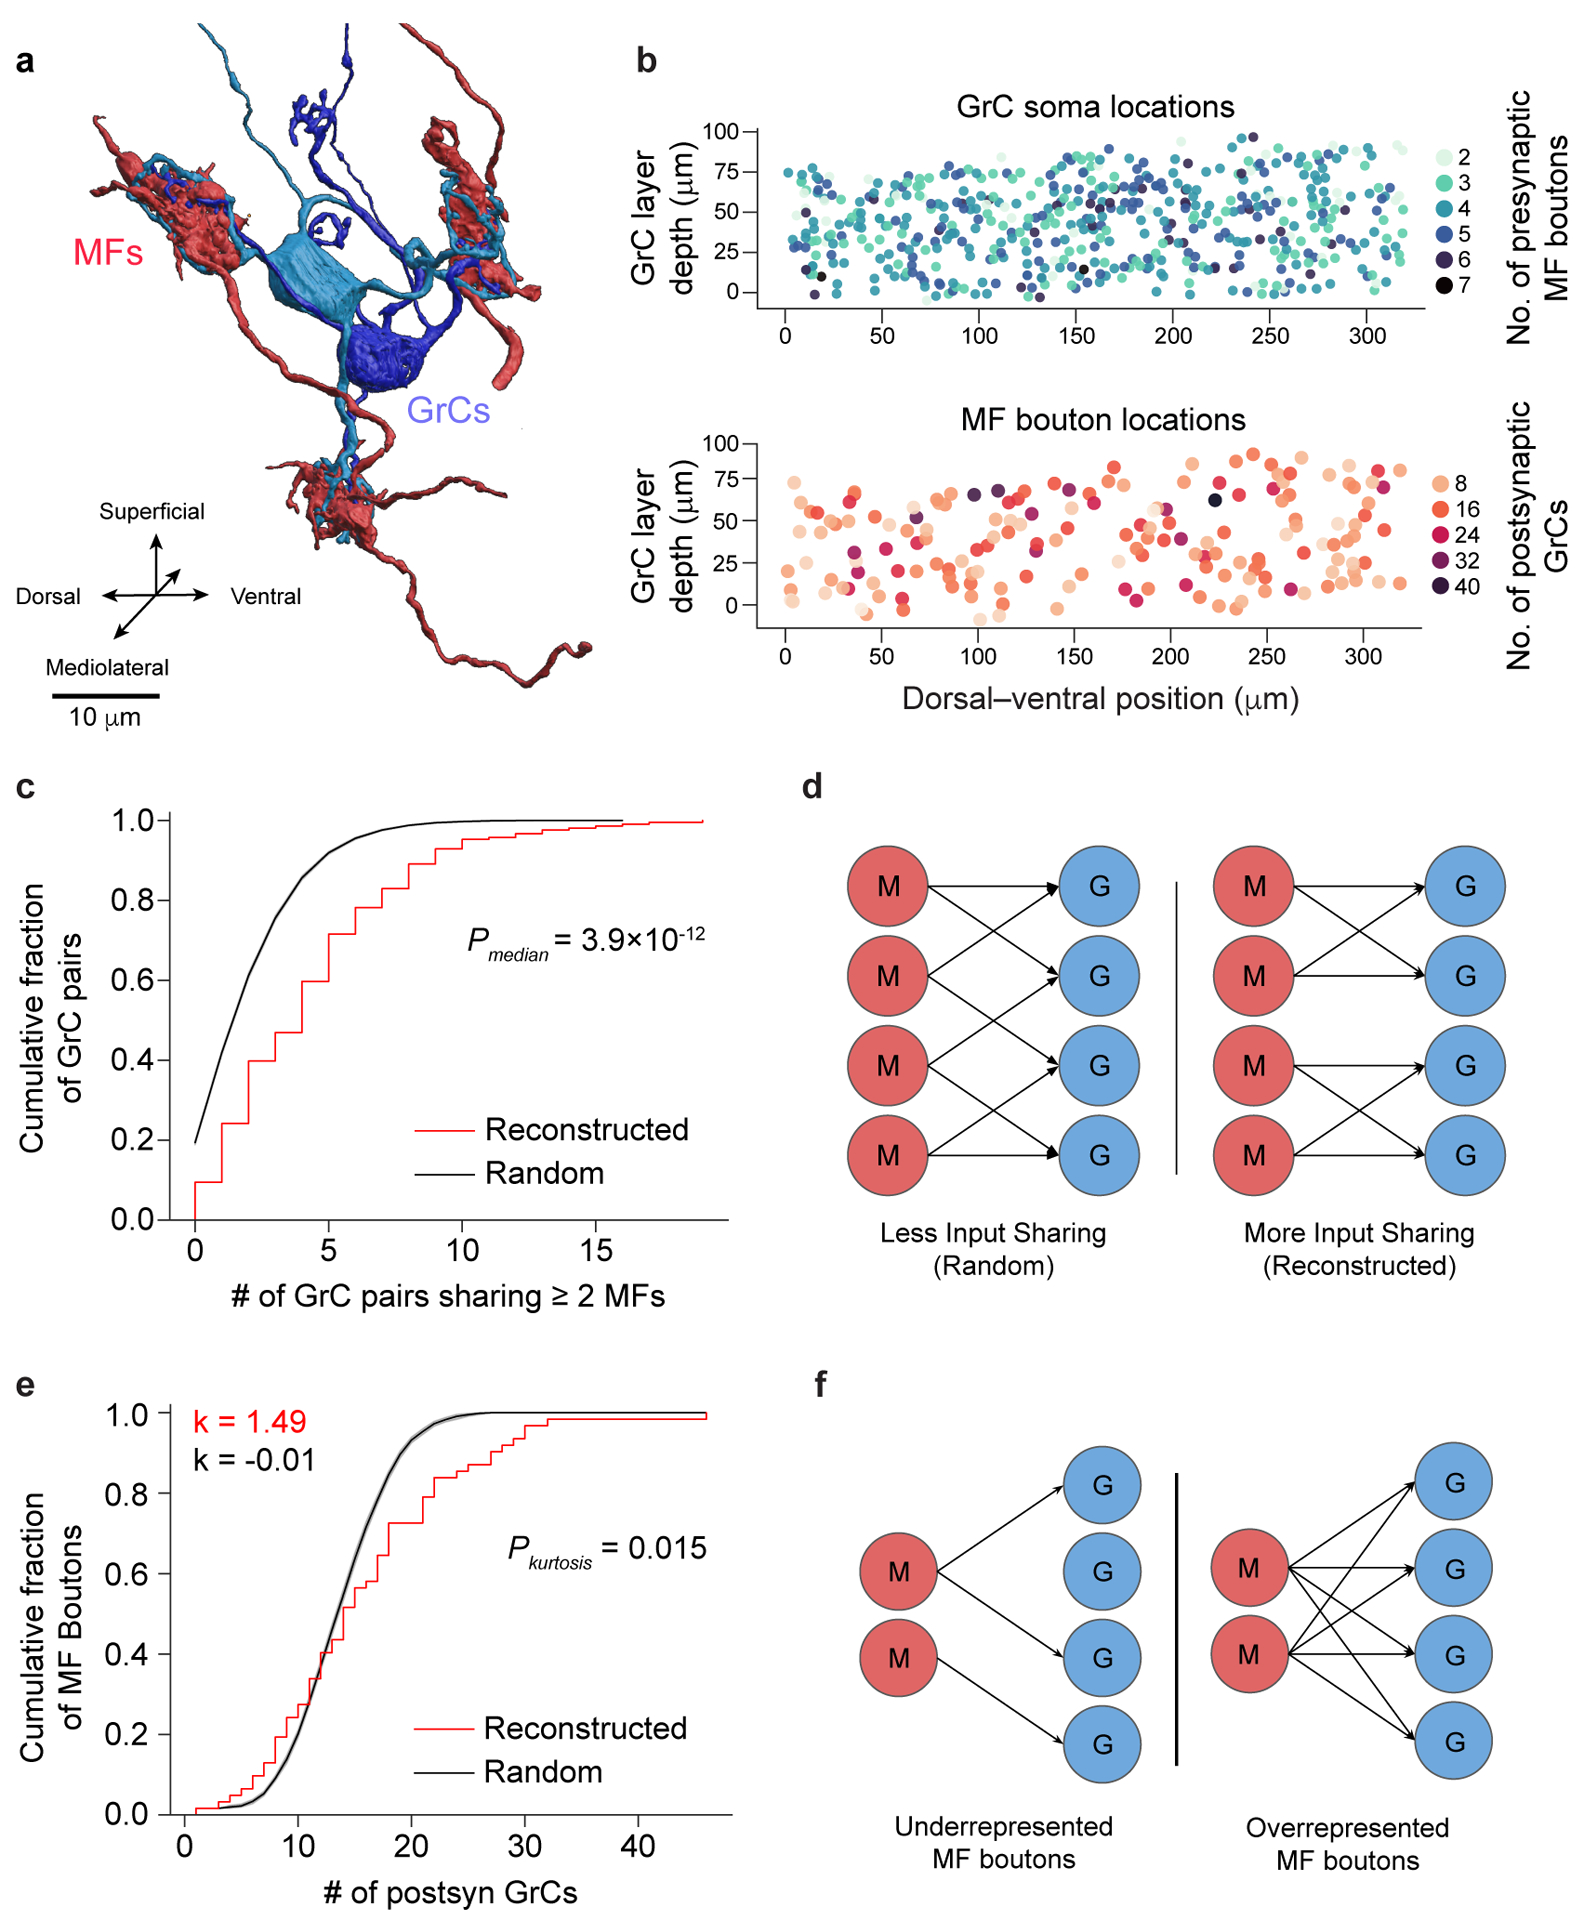
Figure 2. EM reconstructions reveal GrCs redundantly sample MF boutons.

a, 3D rendering of two GrCs (blue) sharing three common MF bouton inputs (red). b, Locations of GrCs (top, n = 4,400, color coded to show the number of dendrites) and MF boutons (bottom, n = 1,145, color coded to show the number of postsynaptic GrCs per bouton). Only neurons in the center 10 μm in the mediolateral axis are plotted for clarity. Within a 320 × 80 × 50 μm subvolume, there are 2,397 GrCs and 784 MF boutons, giving a density of 1,870,000 GrCs and 612,000 MF boutons per mm3 and a ratio of 3.06 GrCs per MF bouton. c, Cumulative distribution of MF bouton input redundancy, counting the number of GrC pairs sharing at least 2 MF boutons for each GrC. To minimize edge-effects, only the centermost GrCs (n = 211, Methods) are included in this analysis. GrCs in the reconstructed network (red line) share significantly more MF boutons than connectomically-constrained random models (Radius model Extended Data Figure 3, black line; p = 3.94 × 10⁻¹², two-sided Wilcoxon rank-sum test, Methods). Here, and throughout the figures shaded regions represent the bootstrapped 95% confidence interval around data mean unless otherwise stated. d, Illustration of redundant sampling in c showing pairs of GrCs sharing 2 common MF inputs (right) vs sharing 1 common MF input (left). e, Cumulative distribution of postsynaptic GrCs per MF bouton. The reconstructed distribution (red line) is compared with a random model (black line, as in c). To minimize edge effects, only connections from the centermost MF boutons are counted (n = 62). Kurtosis (k), a unitless measure of amount of distribution in the tails, is significantly higher in the reconstructed network than the random model suggesting over- and under-sampling of MF boutons by GrCs (p = 0.0146, n = 62, two-sided Permutation test, Methods). f, Selective subsampling of MF boutons by the GrCs in e creates underrepresented and overrepresented subpopulations.
