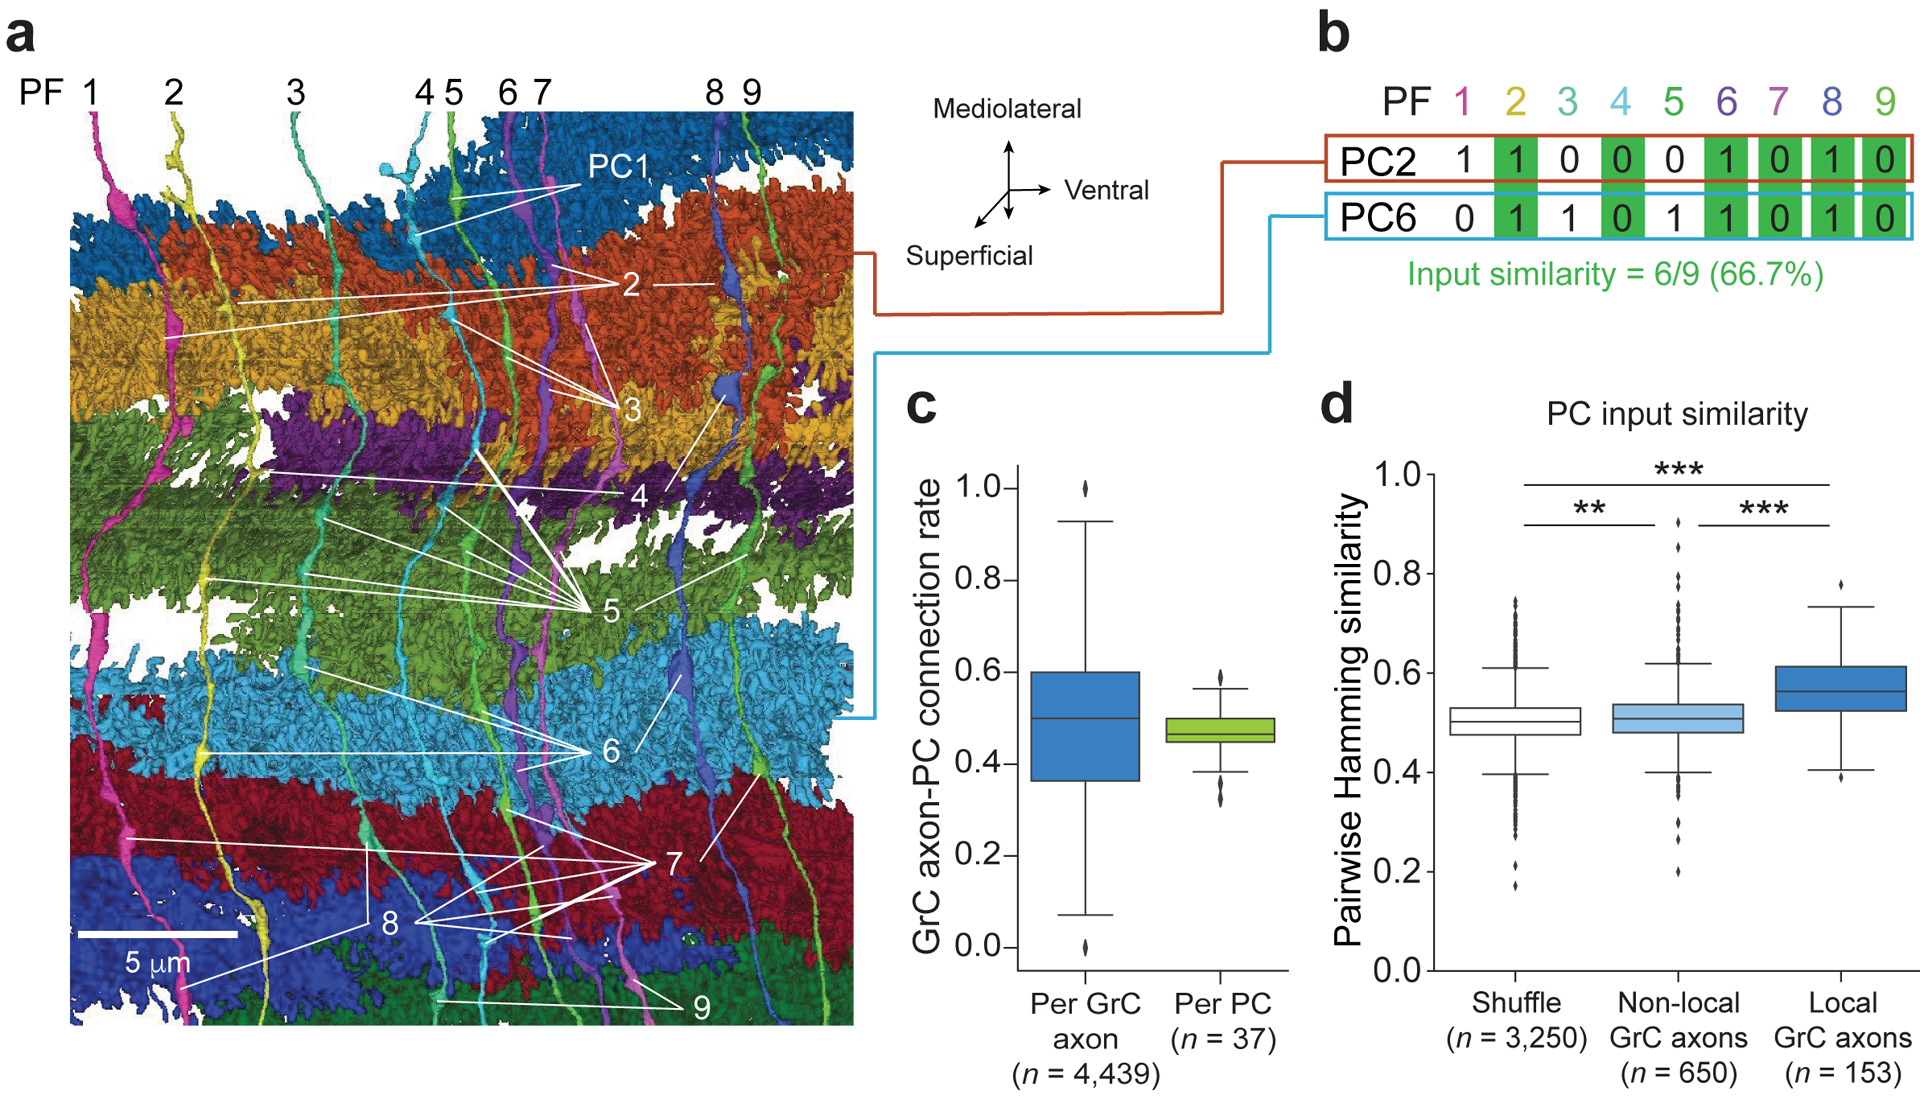
Figure 3. GrC input selectivity predicts PC subnetworks.

a, 3D rendering of nine GrC axons, nine PCs, and the locations of synapses (white lines) connecting them. Note, unlabeled axonal varicosities are presynaptic to non-PC neurons (e.g., molecular layer interneurons). b, Calculation of Hamming similarity as a pairwise metric to compare the similarity of two binary patterns. The example compares the postsynaptic connectivity pattern between two PCs from different parallel fibers (PFs) where a “1” denotes a connection and a “0” denotes the lack of connection. c, Box plot (25th, 50th and 75th percentiles with whiskers extended to points within 1.5 IQRs) of the ratio of GrC→PC synapses to the total number of times a GrC axon and PC pair contact (touch) one another (Methods). Left: synapse ratio per GrC. Right: synapse ratio per PC. d, Similarity of GrC inputs between pairs of PCs with at least 30 common GrC axon contacts comparing shuffled input connectivity, non-local GrC axons, and local GrC axons. All three populations are significantly different (p = 1.25 × 10−56, Kruskal-Wallis test; p = 0.00433, shuffle vs. non-local GrC axons; p = 9.16 × 10⁻³², non-local GrC axons vs. local GrC axons; p = 4.91 × 10−61, shuffle vs. non-local GrC axons; Dunn’s post hoc tests, Bonferroni corrected for multiple comparisons).
