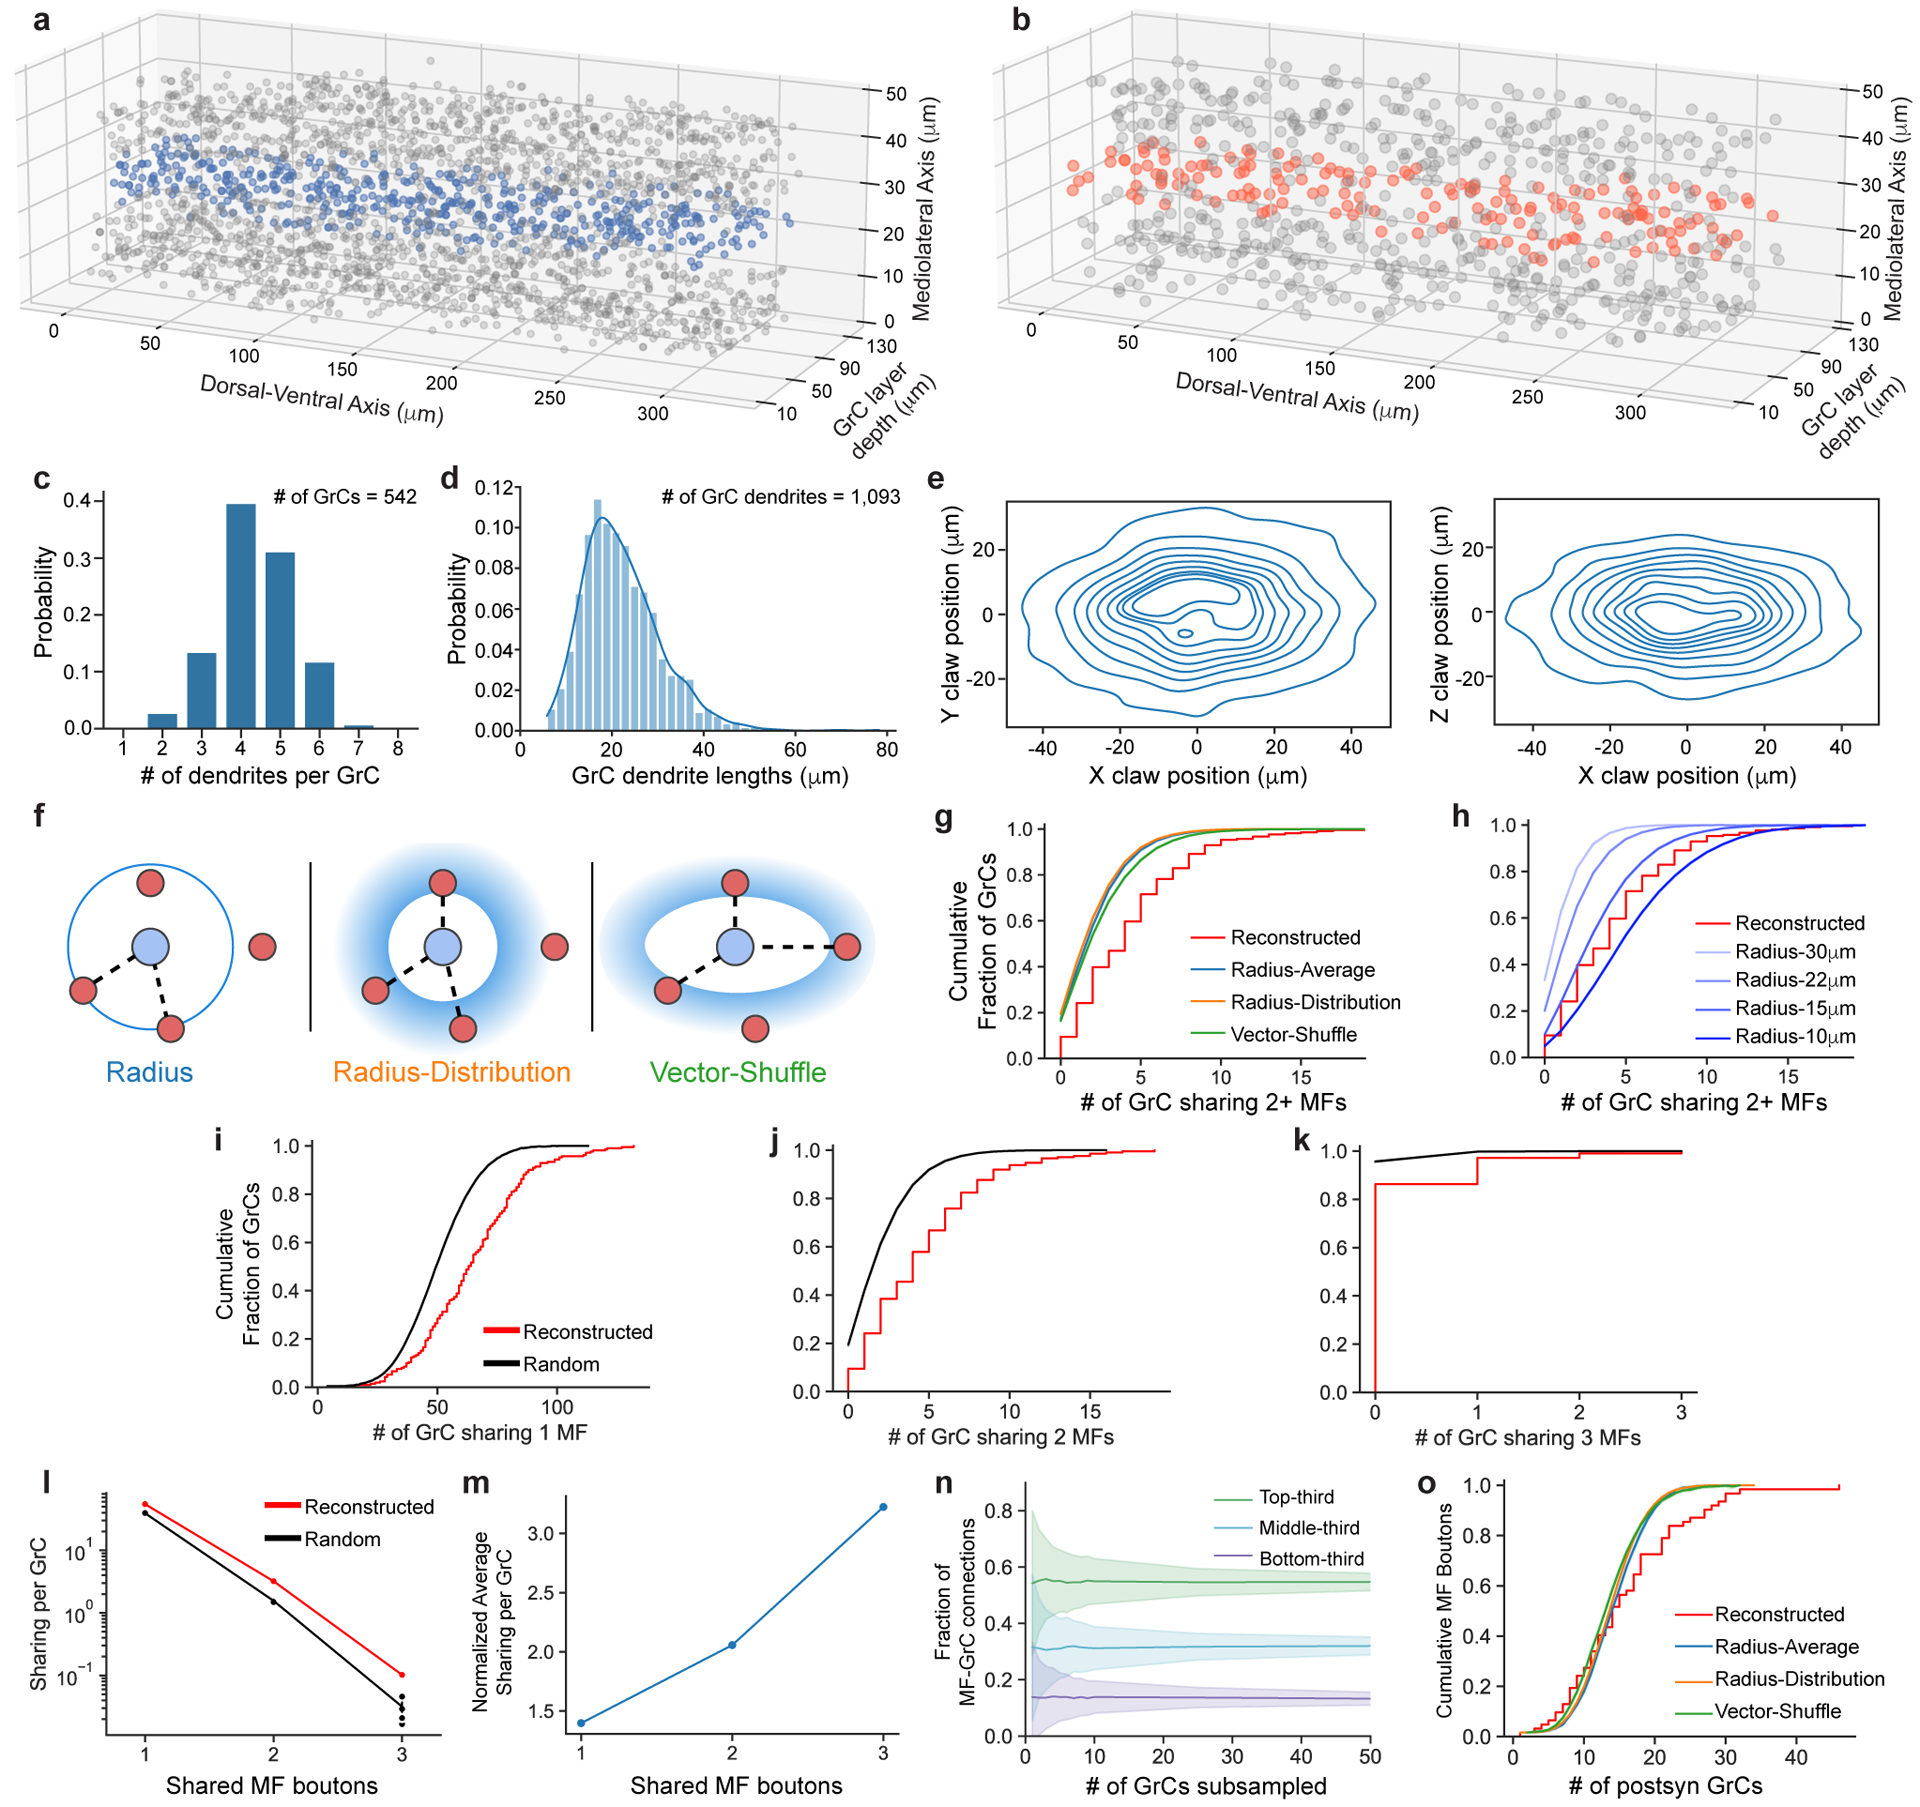
Extended Data Figure 3. MF→GrC wiring, convergence, and null models.

a,b, 3D plot of the locations of GrC somas and centers of MF boutons reconstructed in the 320 × 80 × 50 μm subvolume. Blue and orange dots indicate the GrCs and MF boutons respectively in the center 10 μm in the mediolateral axis, as plotted in Fig. 2b. c, Distribution of the number of dendrites per GrC (n = 542). d, Distribution of GrC dendrite lengths (n = 1093). e, Anisotropic positioning of MF bouton→GrC inputs (claws), showing elongated distribution in the dorsal-ventral axis (X) relative to both anterior-posterior (Y) and medio-lateral (Z) axes. Contour lines represent 10% intervals in the distribution. f, MF→GrC random models used for comparison with the reconstructed connectivity. (Methods). g, Similar to Fig. 2c, but with random models from f added. h, Similar to g, but with Radius models of different dendrite lengths. i, Cumulative distribution of MF bouton input redundancy counting the number of GrC pairs sharing 1 MF bouton (similar to Fig. 2c). j, Similar to i, but for 2 MF boutons. k, Similar to i, but for 3 MF boutons. l, Average number of GrC pairs sharing 1, 2, or 3 common MF bouton inputs, comparing reconstructed against the Radius random connectivity model described in d. m, Average sharing of GrCs in the reconstructed network as in l, but normalized to random networks. n, Average fractional distribution of inputs to GrCs from different MF bouton types (categorized as the top-third, middle-third, and bottom third most connected boutons) as a function of GrC sampling size. GrCs were randomly subsampled to produce input composition distributions, with error shadings representing SD. o, Same as Fig. 2e, but with random models from f added.
