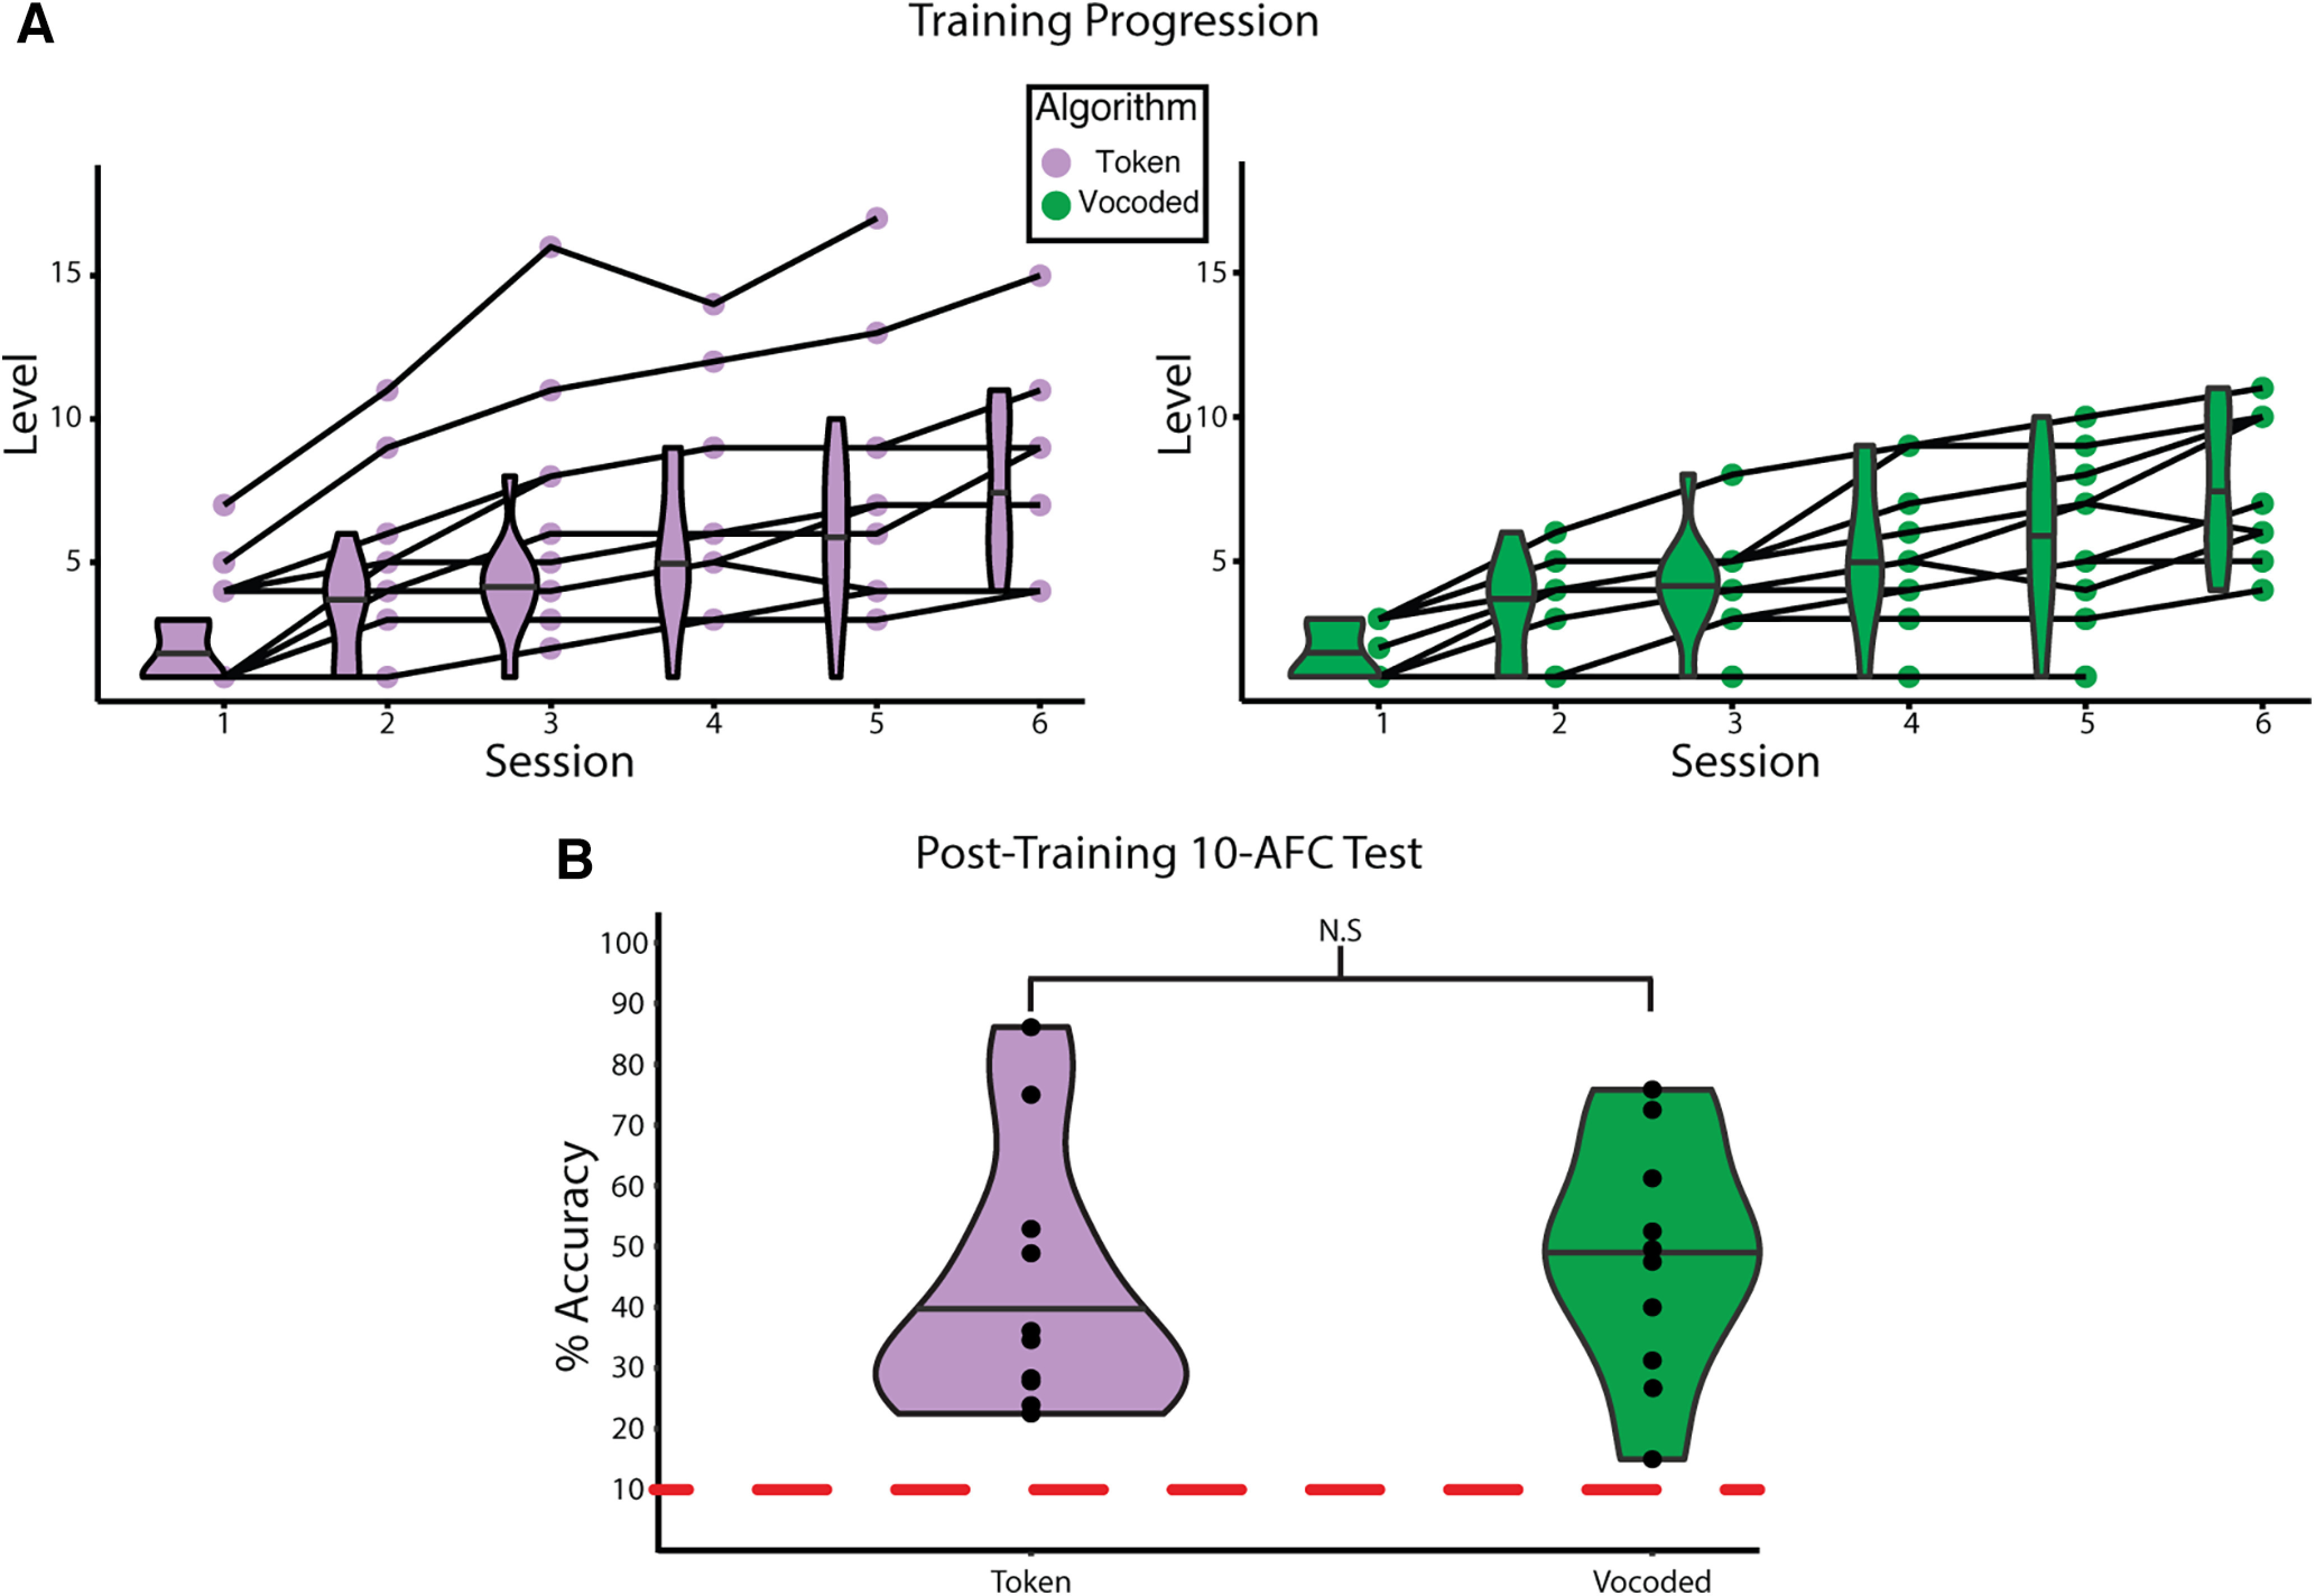
Figure 3.

Progression of learning VT stimuli as speech. A, The performance of individuals on the behavioral training paradigm across sessions. Training progression for subjects in the token-based (left) and vocoded VT (right) groups, respectively. Data for the final training sessions for 2 subjects, one per group, are missing because of technical error. Shaded lines connect the same individual across sessions. Data for the final session of 2 subjects were lost because of technical error. B, The performance of subjects by algorithm group on 10-AFC task completed after the final post-training fMRI scan. A two-sample t test reveals no significant difference in performance between the groups (t(18) = 0.386, p = 0.704). Dashed red line indicates chance performance. Horizontal lines in the violin plots indicate the median.
