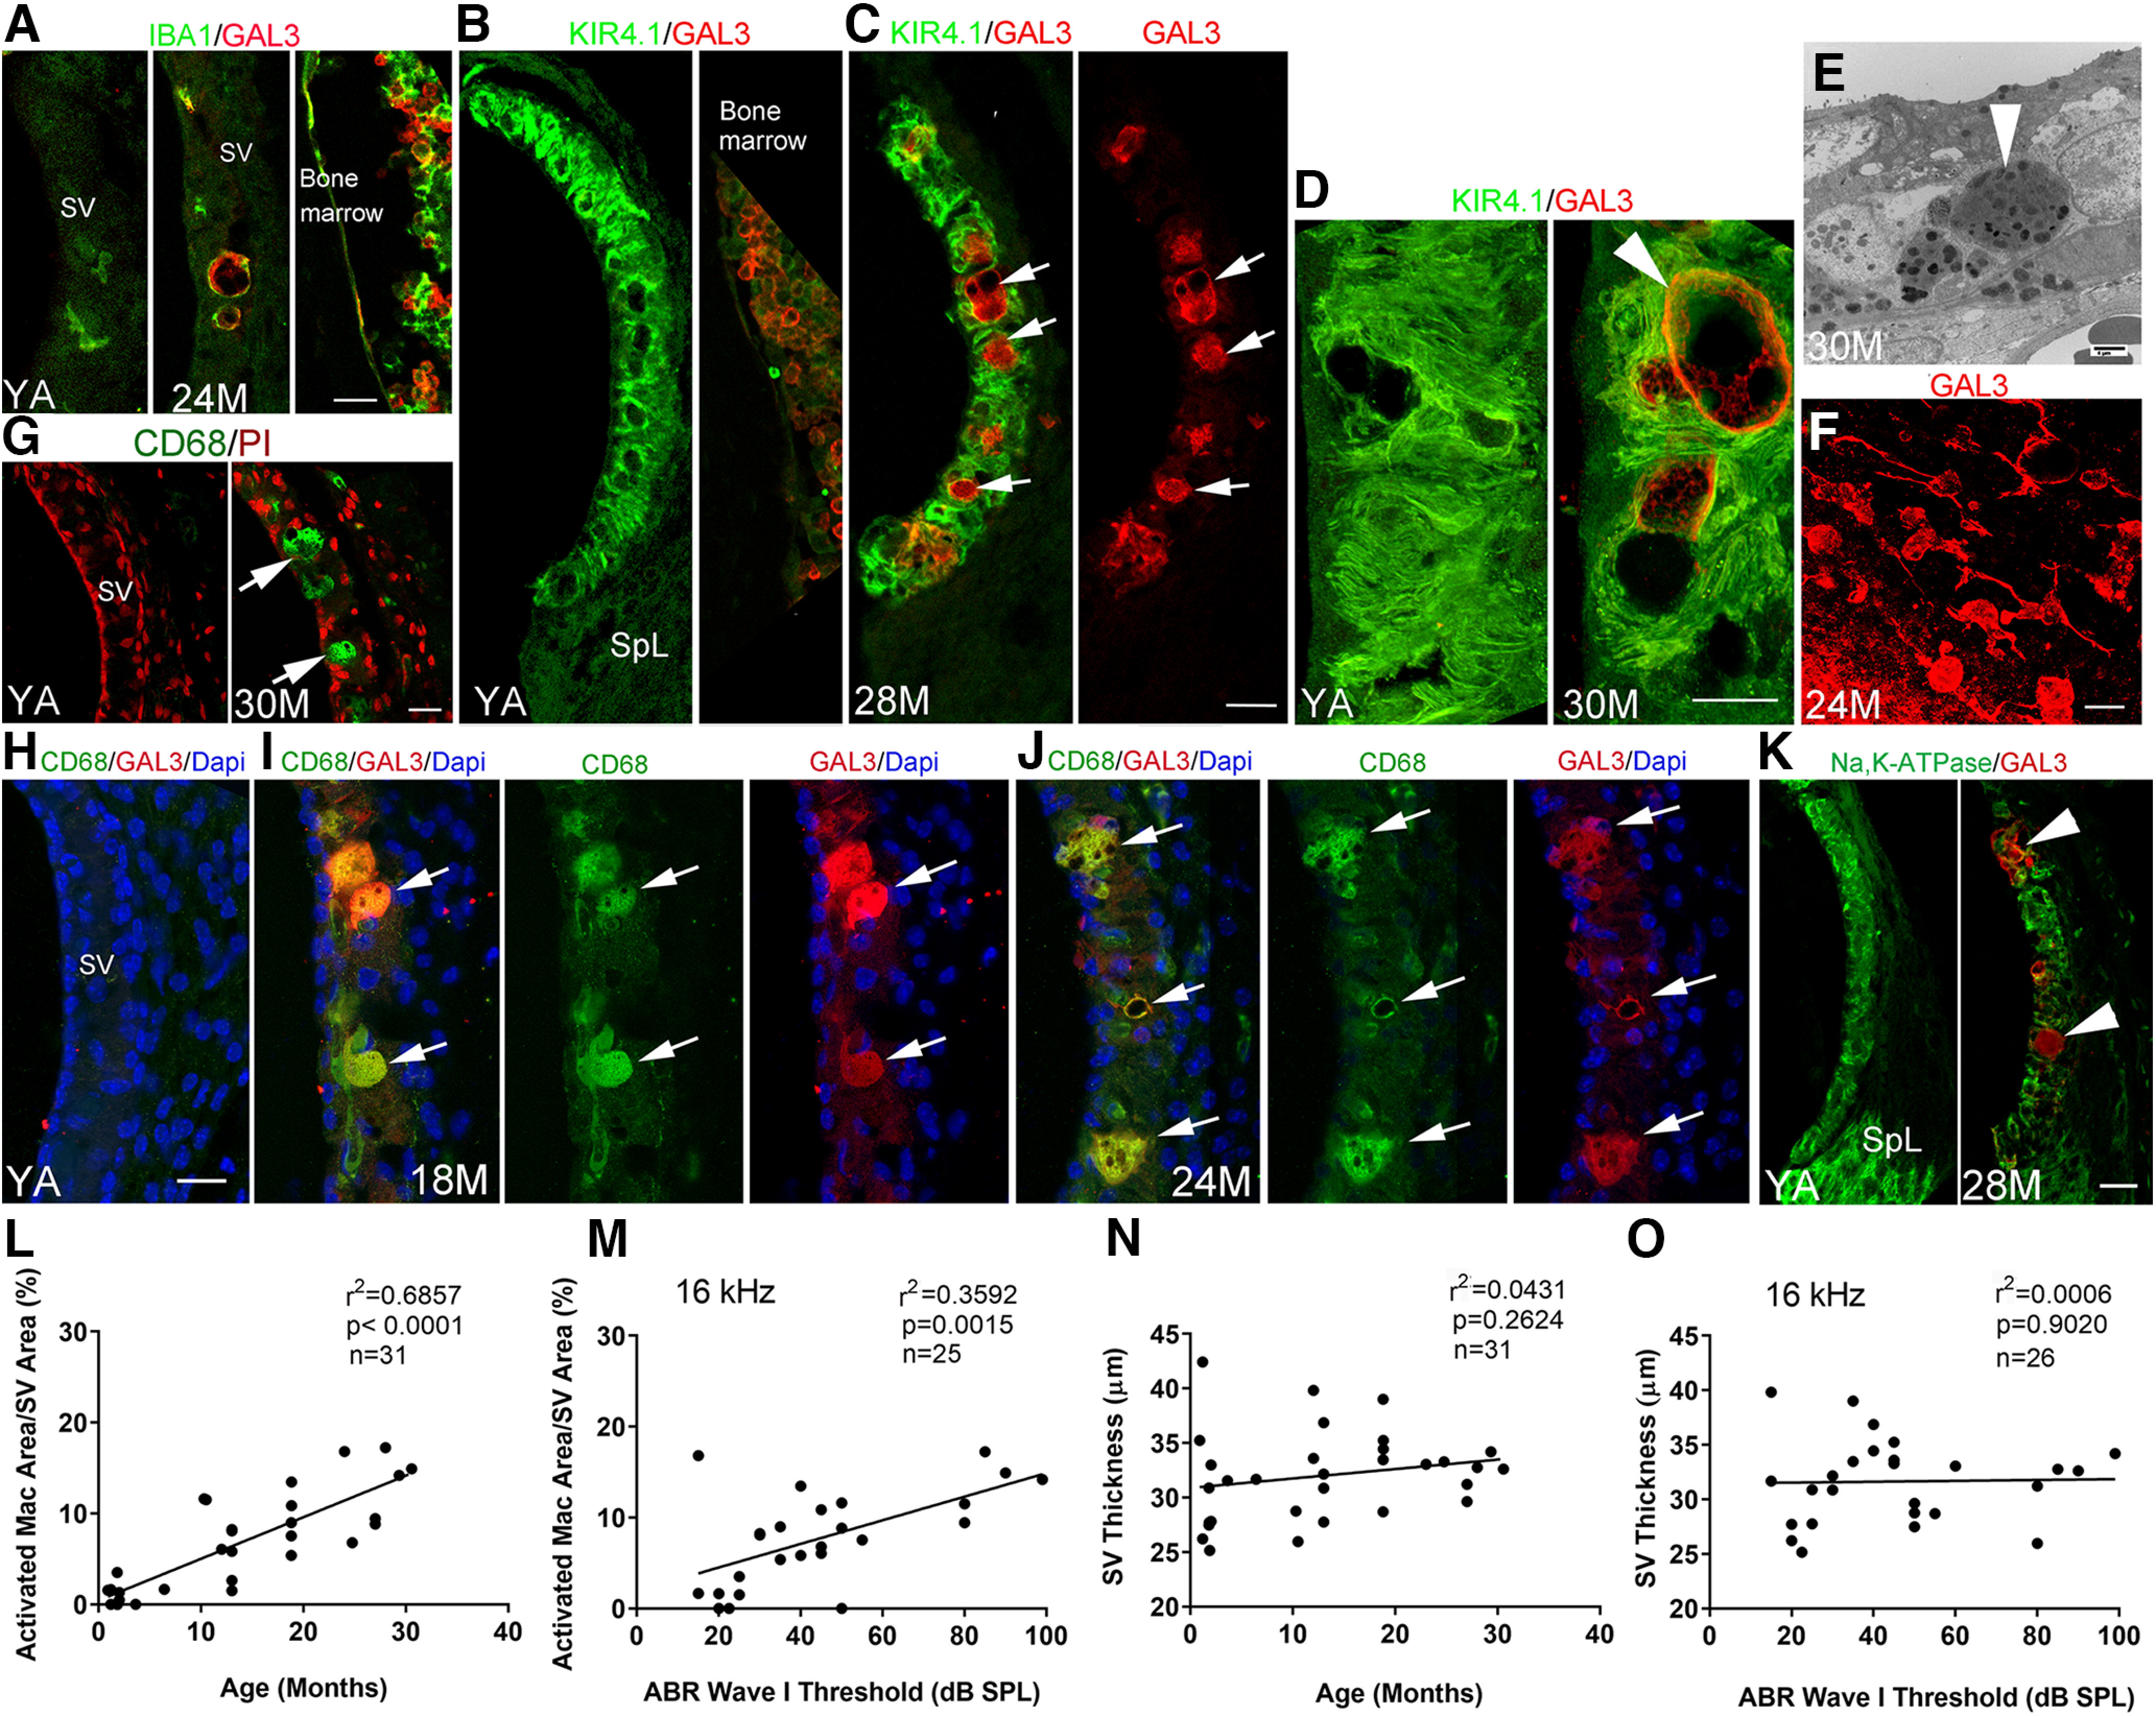
Figure 3.

Macrophage dysfunction in the SV, but not SV thickness, is associated with age and ABR Wave I thresholds in CAB/CaJ mice. A, Immunohistochemical analysis of IBA1 (macrophages) and the inflammation marker Galectin3 (GAL3) showed that activated macrophages expressed GAL3 in the SV of aged mice. The right panel illustrates dual staining for IBA1 and KIR4.1 in bone marrow of the same YA mouse used for the image in the left panel. B, C, Dual-immunostaining for KIR4.1 and GAL3 revealed limited if any colocalization in the SV of the YA mice. In the SV of aged mice, an increase in GAL3+ cells (arrows) was present between but not within the KIR4.1+ cellular processes of intermediate cells. D, High-resolution images of the SV in YA and aged (30 M) mice revealed GAL3+ macrophages (arrowhead) with large melanosome-like dark inclusions. E, Ultrastructural image of the SV in an aged mouse showed a macrophage-like cell with lysosome-like bodies (arrowhead) and numerous dark inclusions comparable to the cellular changes in the GAL3+ macrophages seen in D. F, Many GAL3+ activated macrophages were seen in the SV of aged mice in whole-mount preparations. G, Macrophages in the SV of an aged mouse were positive for CD68 (arrows). H–J, Dual-immunostaining of CD68 and GAL3 detects CD68+/GAL3+ activated macrophages (arrows) in middle-aged (I) and aged (J) mice but not in YA mice (H). K, GAL3+ cells (arrowheads) are increased in aged mice SV, but these cells were associated with diminished staining for Na,K-ATPase (α subunit). L–O, Linear regression analyses (see statistical results included in graphs in L–O) revealed a significant age-dependent and ABR Wave I threshold-dependent association with area occupied by activated macrophages in the middle portion of the SV in CBA/CaJ mice. In contrast, neither mouse age nor ABR Wave I threshold was significantly associated with SV thickness. Scale bars: 20 µm in A, G, F; 20 µm in C (applies to B, C); 20 µm in H (applies to H–J); 25 µm in K; 10 µm D; and 4 µm in E.
