Figure 4.

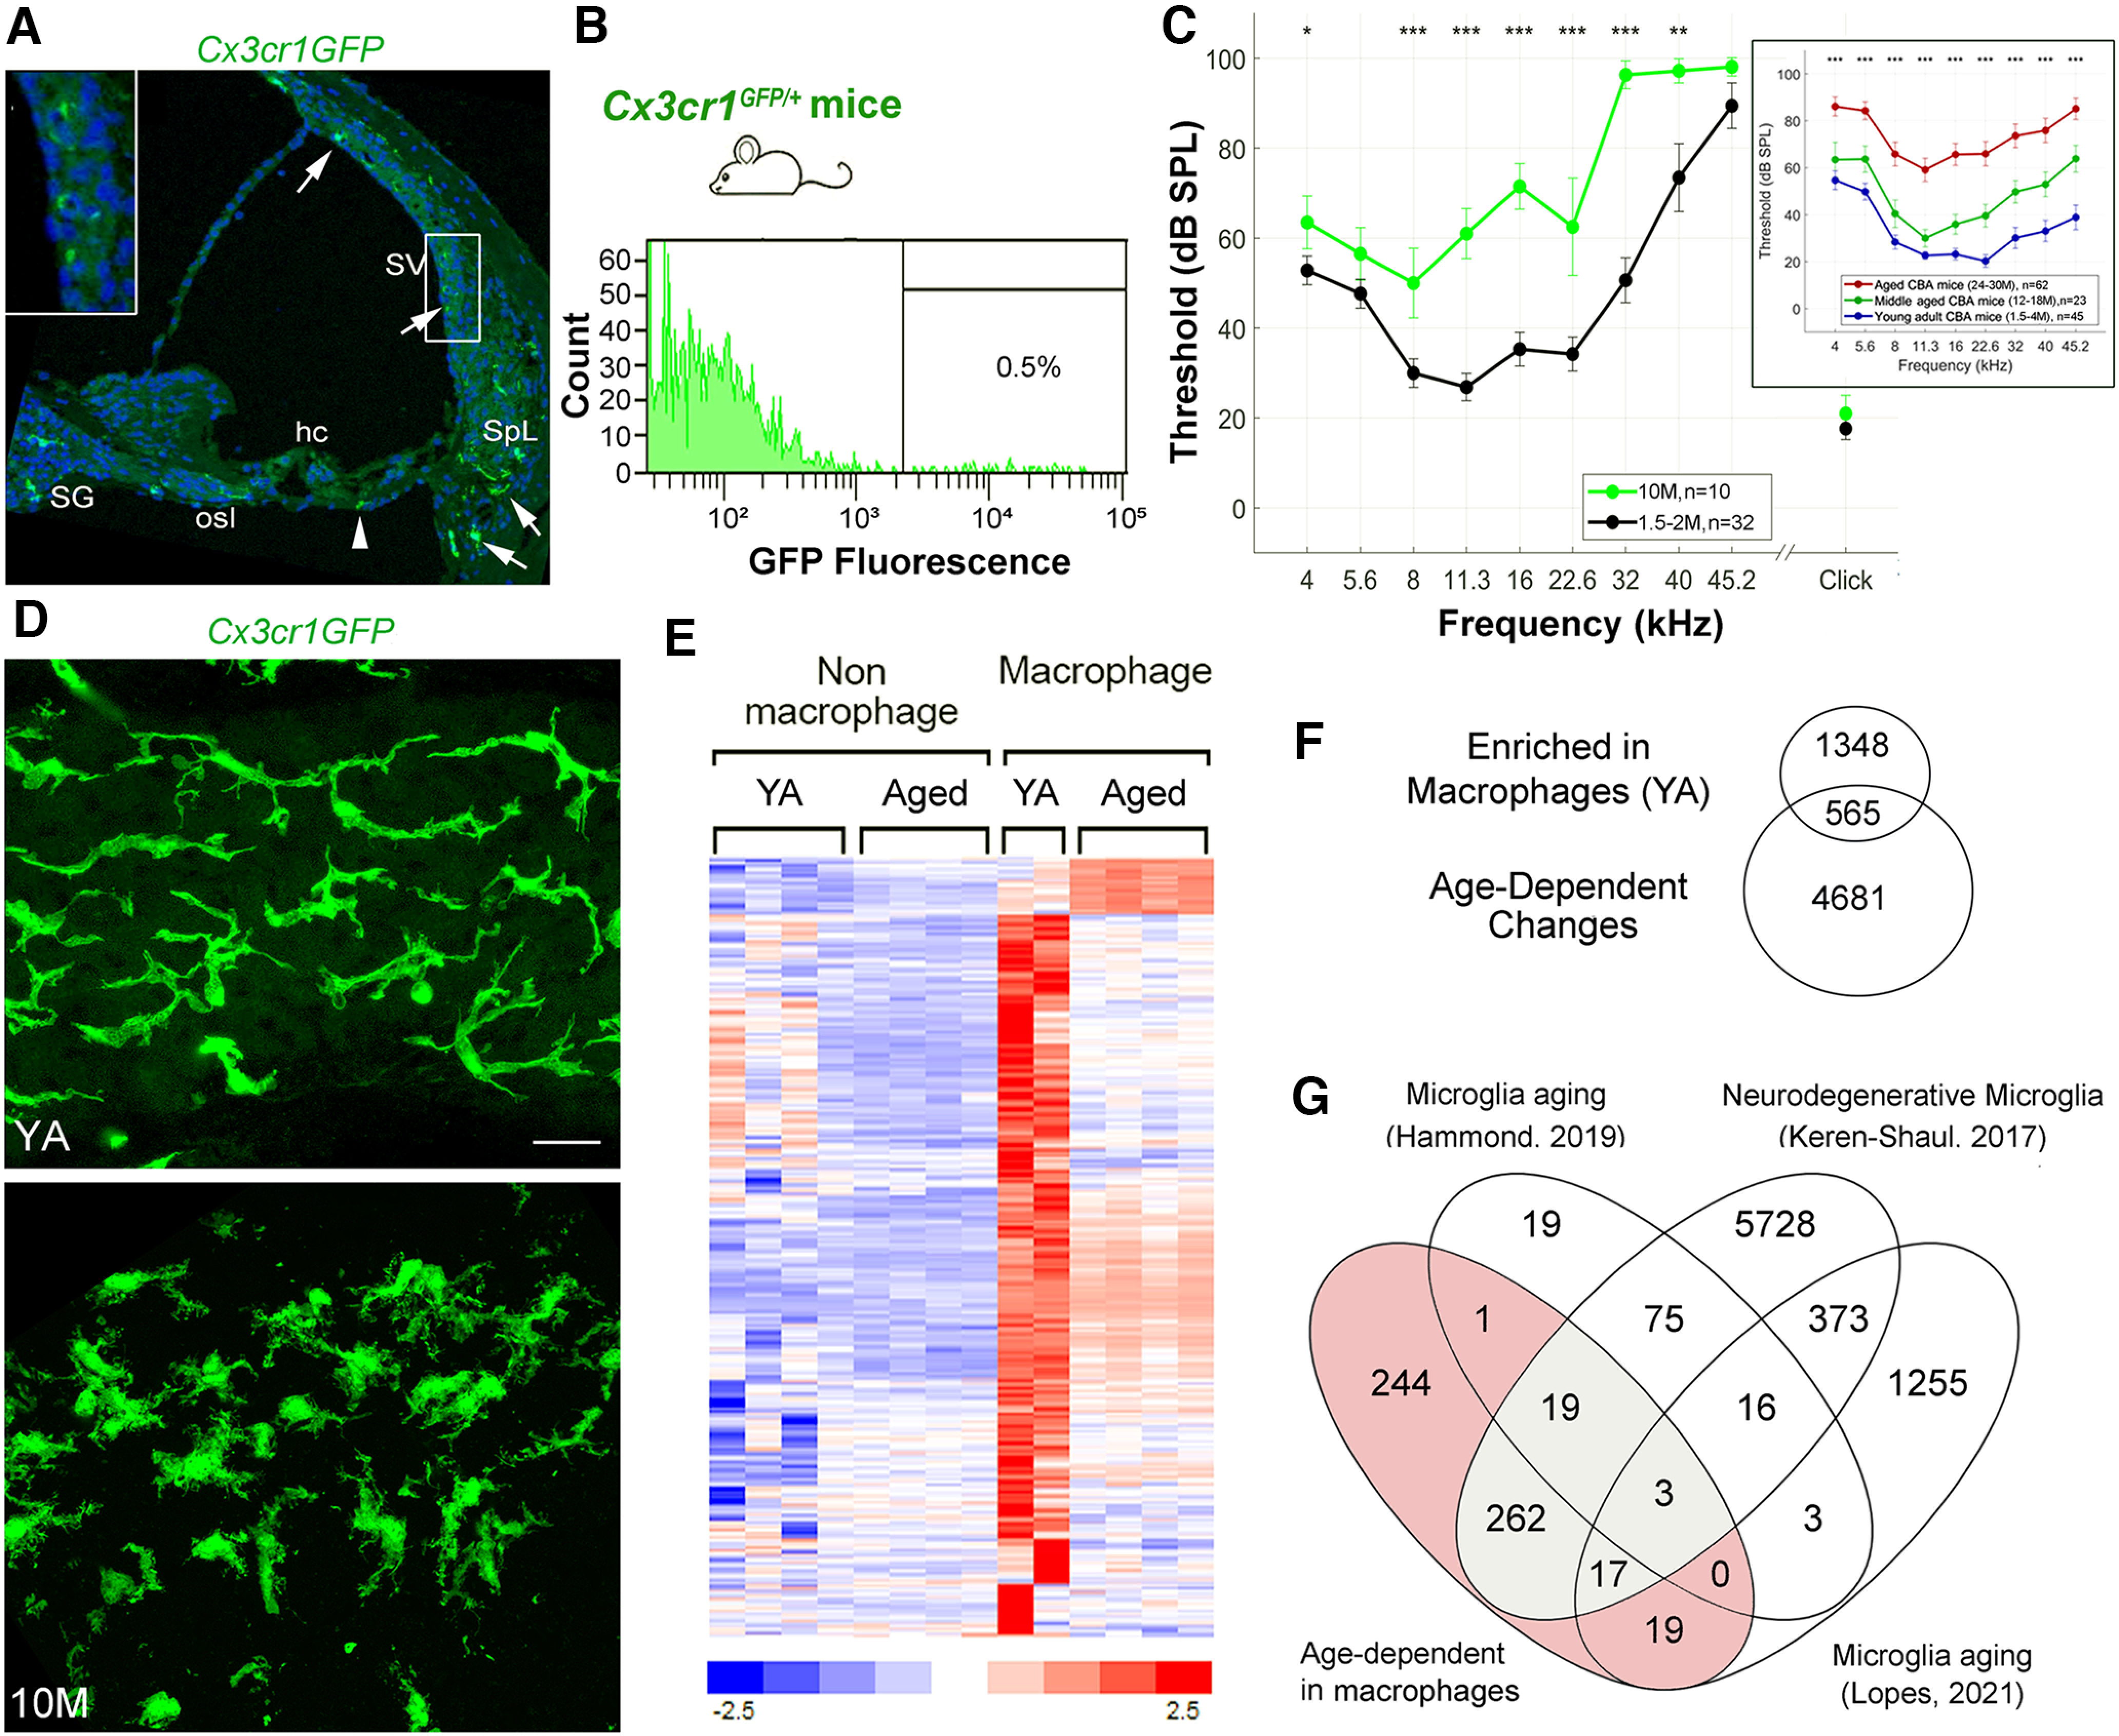
Dysfunction/dysregulation of macrophages in the aged mouse cochlea. A, A confocal micrograph demonstrates the distribution of macrophages (GFP, green) in the cochlea of a young adult (YA) Cx3cr1GFP/+ mouse. Arrows identify Cx3cr1+ cells in the SV, spiral ligament (SpL), osseous spiral lamina (osl), and spiral ganglion (SG). Left-top panel, Enlarged image of the boxed area in the SV. An arrowhead indicates a Cx3cr1+ cell in the tympanic covering layer under the organ of Corti. Nuclei were counterstained with DAPI (blue). Hair cell; hc. B, A representative frequency histogram of the proportion of cells sorted from the cochlea (AN and LW portion combined) of adult Cx3cr1GFP/+ mice, demonstrating the fraction (0.5%) of macrophages harvested via fluorescence-activated cell sorting (FACS). C, Analysis of ABR Wave I thresholds in Cx3cr1GFP/+ mice demonstrates that loss of hearing sensitivity occurs in 10-M-old relative to YA (1.5–2 M) animals. D, Confocal micrographs of the SV of a 2-M-old and a 10-M-old Cx3cr1GFP/+ mouse. Scale bar: 20 µm in D. E, F, Identification of 565 genes significantly differentially expressed between YA macrophages and nonmacrophage cells and between macrophages from YA and aged mouse cochlea. Venn diagram in F represents the significant differentially expressed genes found to (1) be enriched in macrophages from YA mice, 1913 genes; and (2) demonstrate an age-dependent change, 5146 genes. Hierarchical clustering of the 565 genes illustrates the change in gene expression with age, where a small subset exhibits upregulation in the aged macrophage samples and the remaining genes are downregulated when compared with macrophages from YA mice (E; Extended Data Fig. 4-1). G, Venn diagram showing the overlap between the 565 significant macrophage molecular markers (shaded; listed as “Age-dependent in macrophages”) and genes reported in other studies as macrophage/microglia markers linked to aging or disease (Keren-Shaul et al., 2017; Hammond et al., 2019; Lopes et al., 2022). A total of 321 of the 565 were indicated in at least one of the studies (Extended Data Fig. 4-1). Gray shaded region highlights 301 genes reported as biomarkers for disease-associated microglia (Keren-Shaul et al., 2017). Scale bar, 20 µm in D.
