Figure 2.

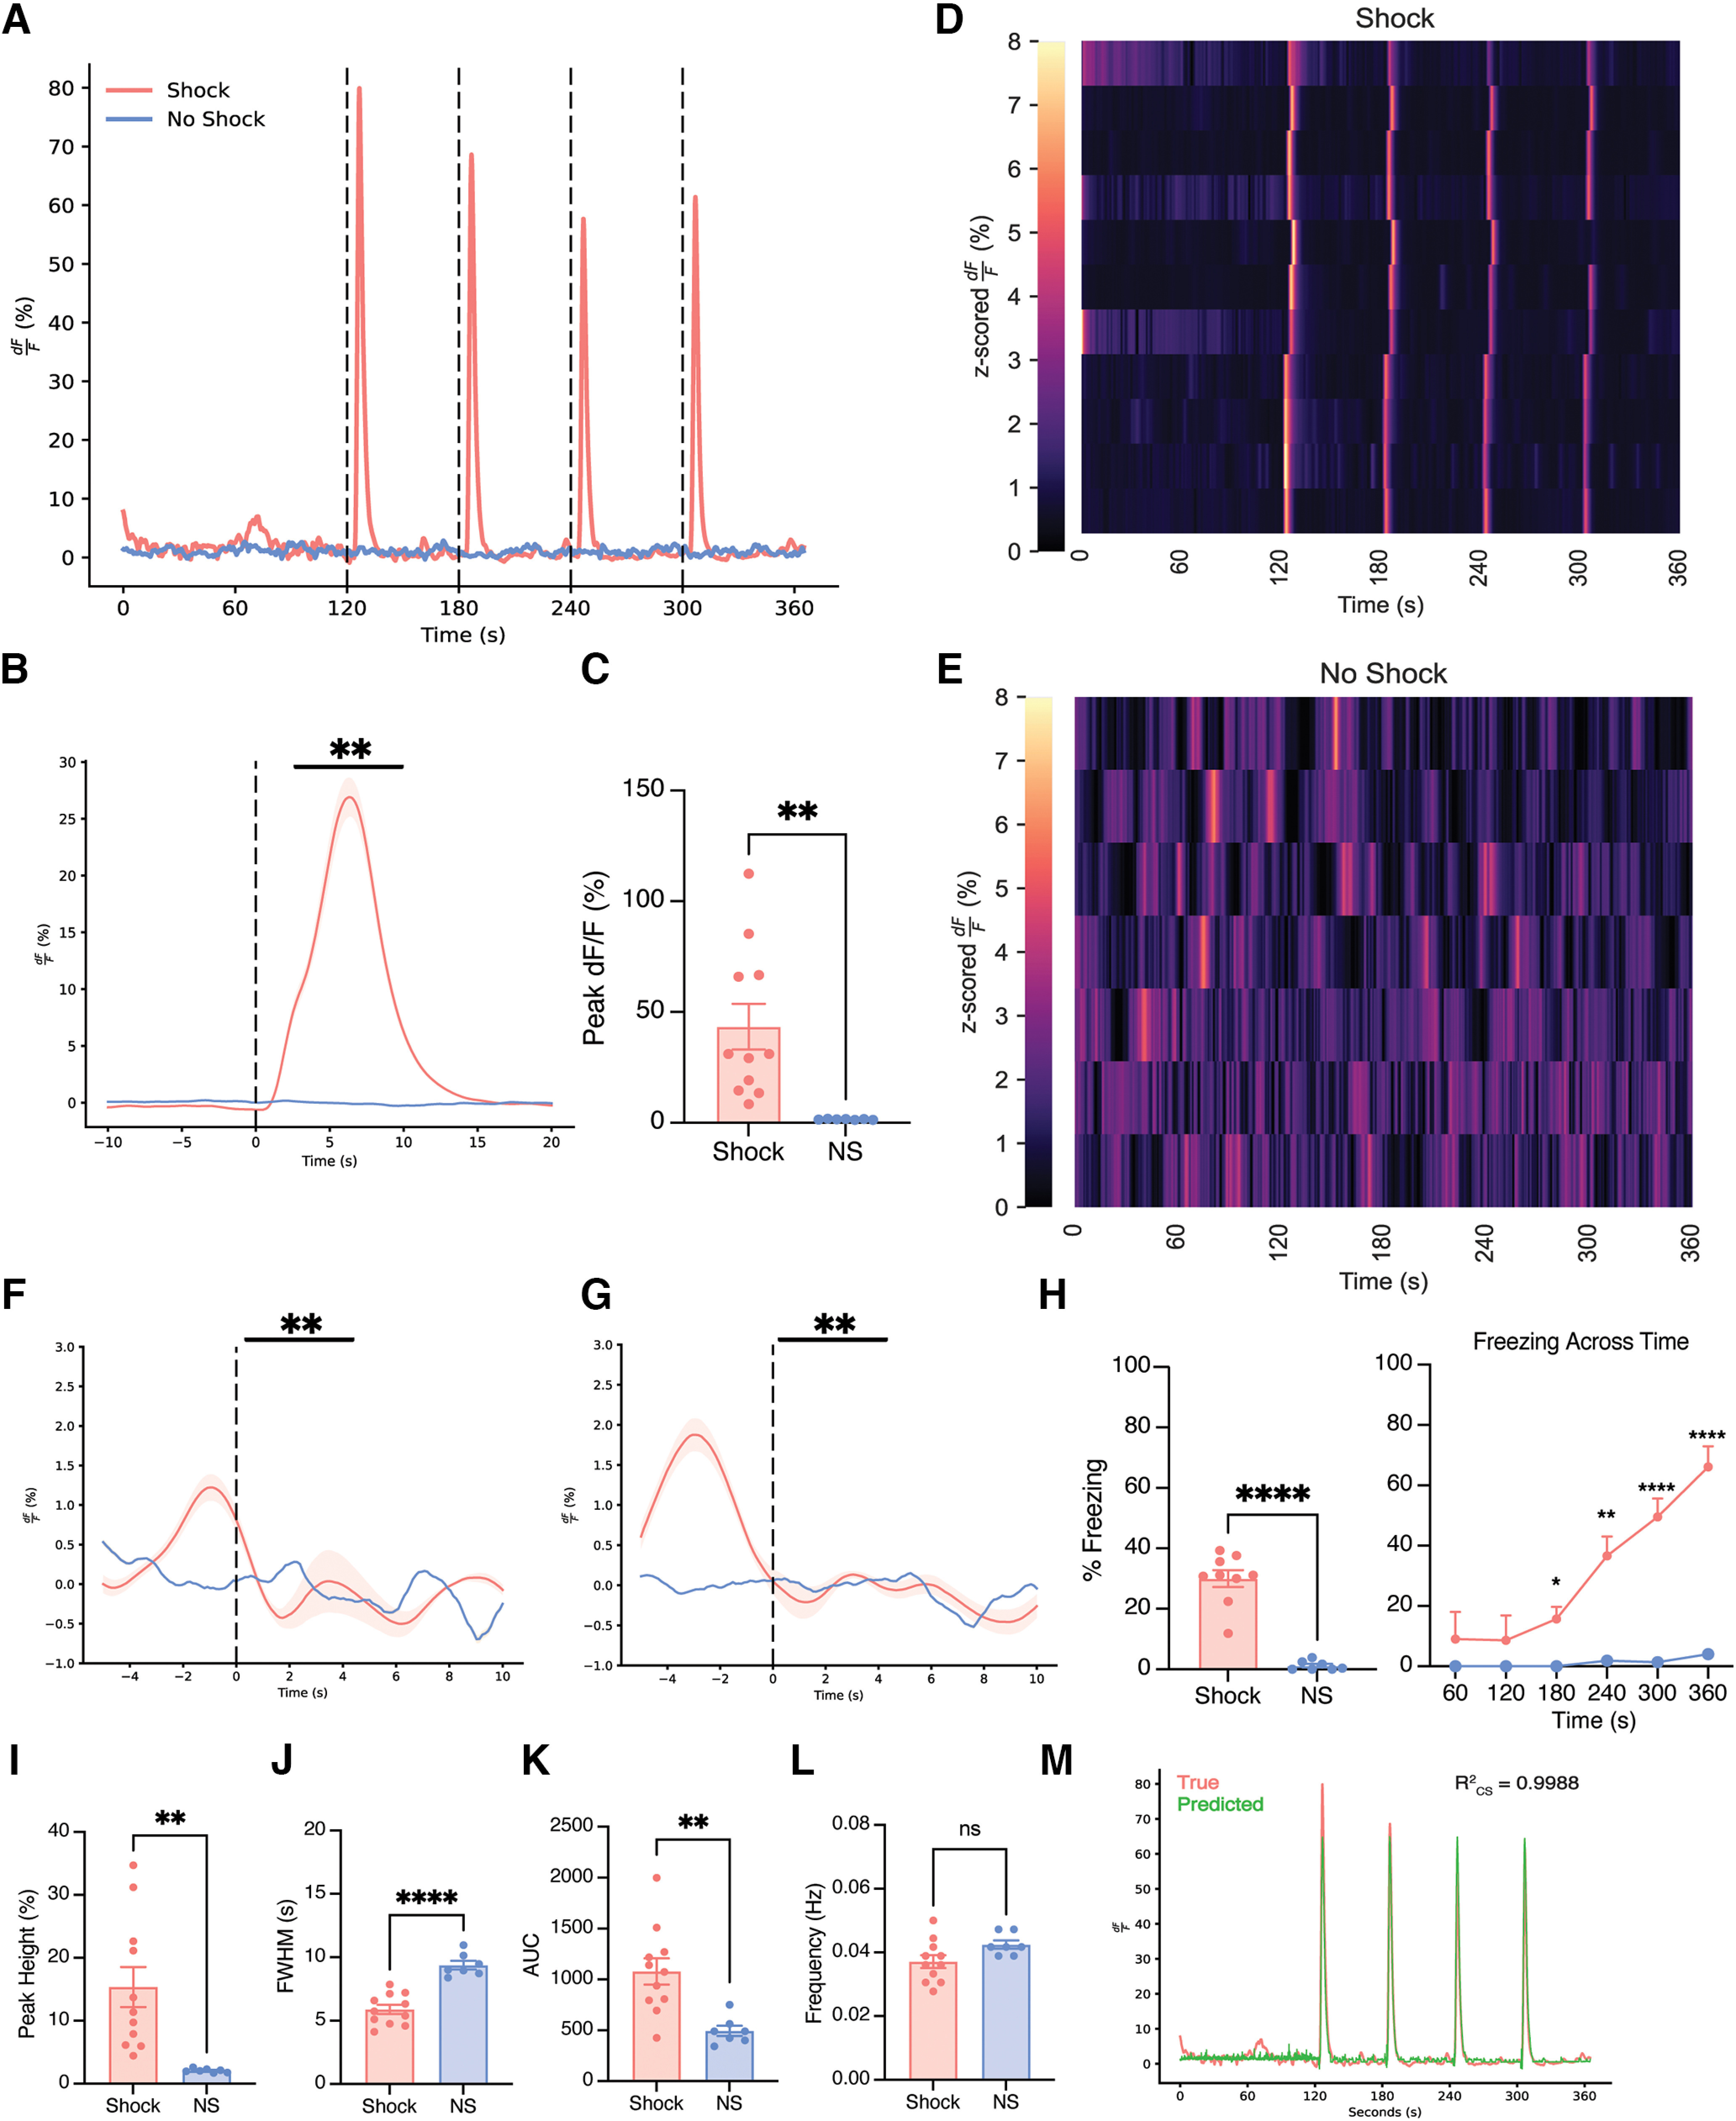
Basolateral amygdala astrocytes robustly respond to foot shock during contextual fear conditioning and exhibit unique calcium event dynamics compared with no-shock controls. A, Representative calcium time series (dF/F percentage) for shock and no-shock conditions during the 360 s CFC session; 1.5 mA foot shocks occurred at the 120, 180, 240 and 300 s time points, as indicated by vertical dashed lines. B, Perievent analysis for 1.5 mA foot shock, with the onset of foot shock occurring at the dashed line (time = 0). C, Quantification of the average percentage change in peak dF/F at the onset of foot shock. D, E, The z-scored dF/F (percentage) across CFC for shock (D) and no-shock conditions (E); each row represents a single subject across time within the session. F, G, Perievent analysis for the initiation (C) and termination (E) of freezing behavior, with each event occurring at the dashed line (time = 0). H, Average percentage freezing (left) and freezing across time within the CFC session (right). I–L, Calcium event metrics; peak height (I), full-width half-maximum (J), area under the curve (K), and frequency (L). M, True (pink) and predicted (green) produced from a generalized linear model. All error bars and bands indicate standard error of the mean (SEM). For t tests and ANOVAs, p ≤ 0.05, **p ≤ 0.01, ***p ≤ 0.001, ****p ≤ 0.0001; ns, Not significant. For perievent metrics, *95% CI, **99% CI; ns. For t tests and ANOVAs, shock n = 11, no shock n = 7. For foot shock perievents, shock n = 11, no shock n = 7. For freezing perievents, shock n = 11, no shock n = 2 because of mice not freezing during this session.
