
Figure 4.
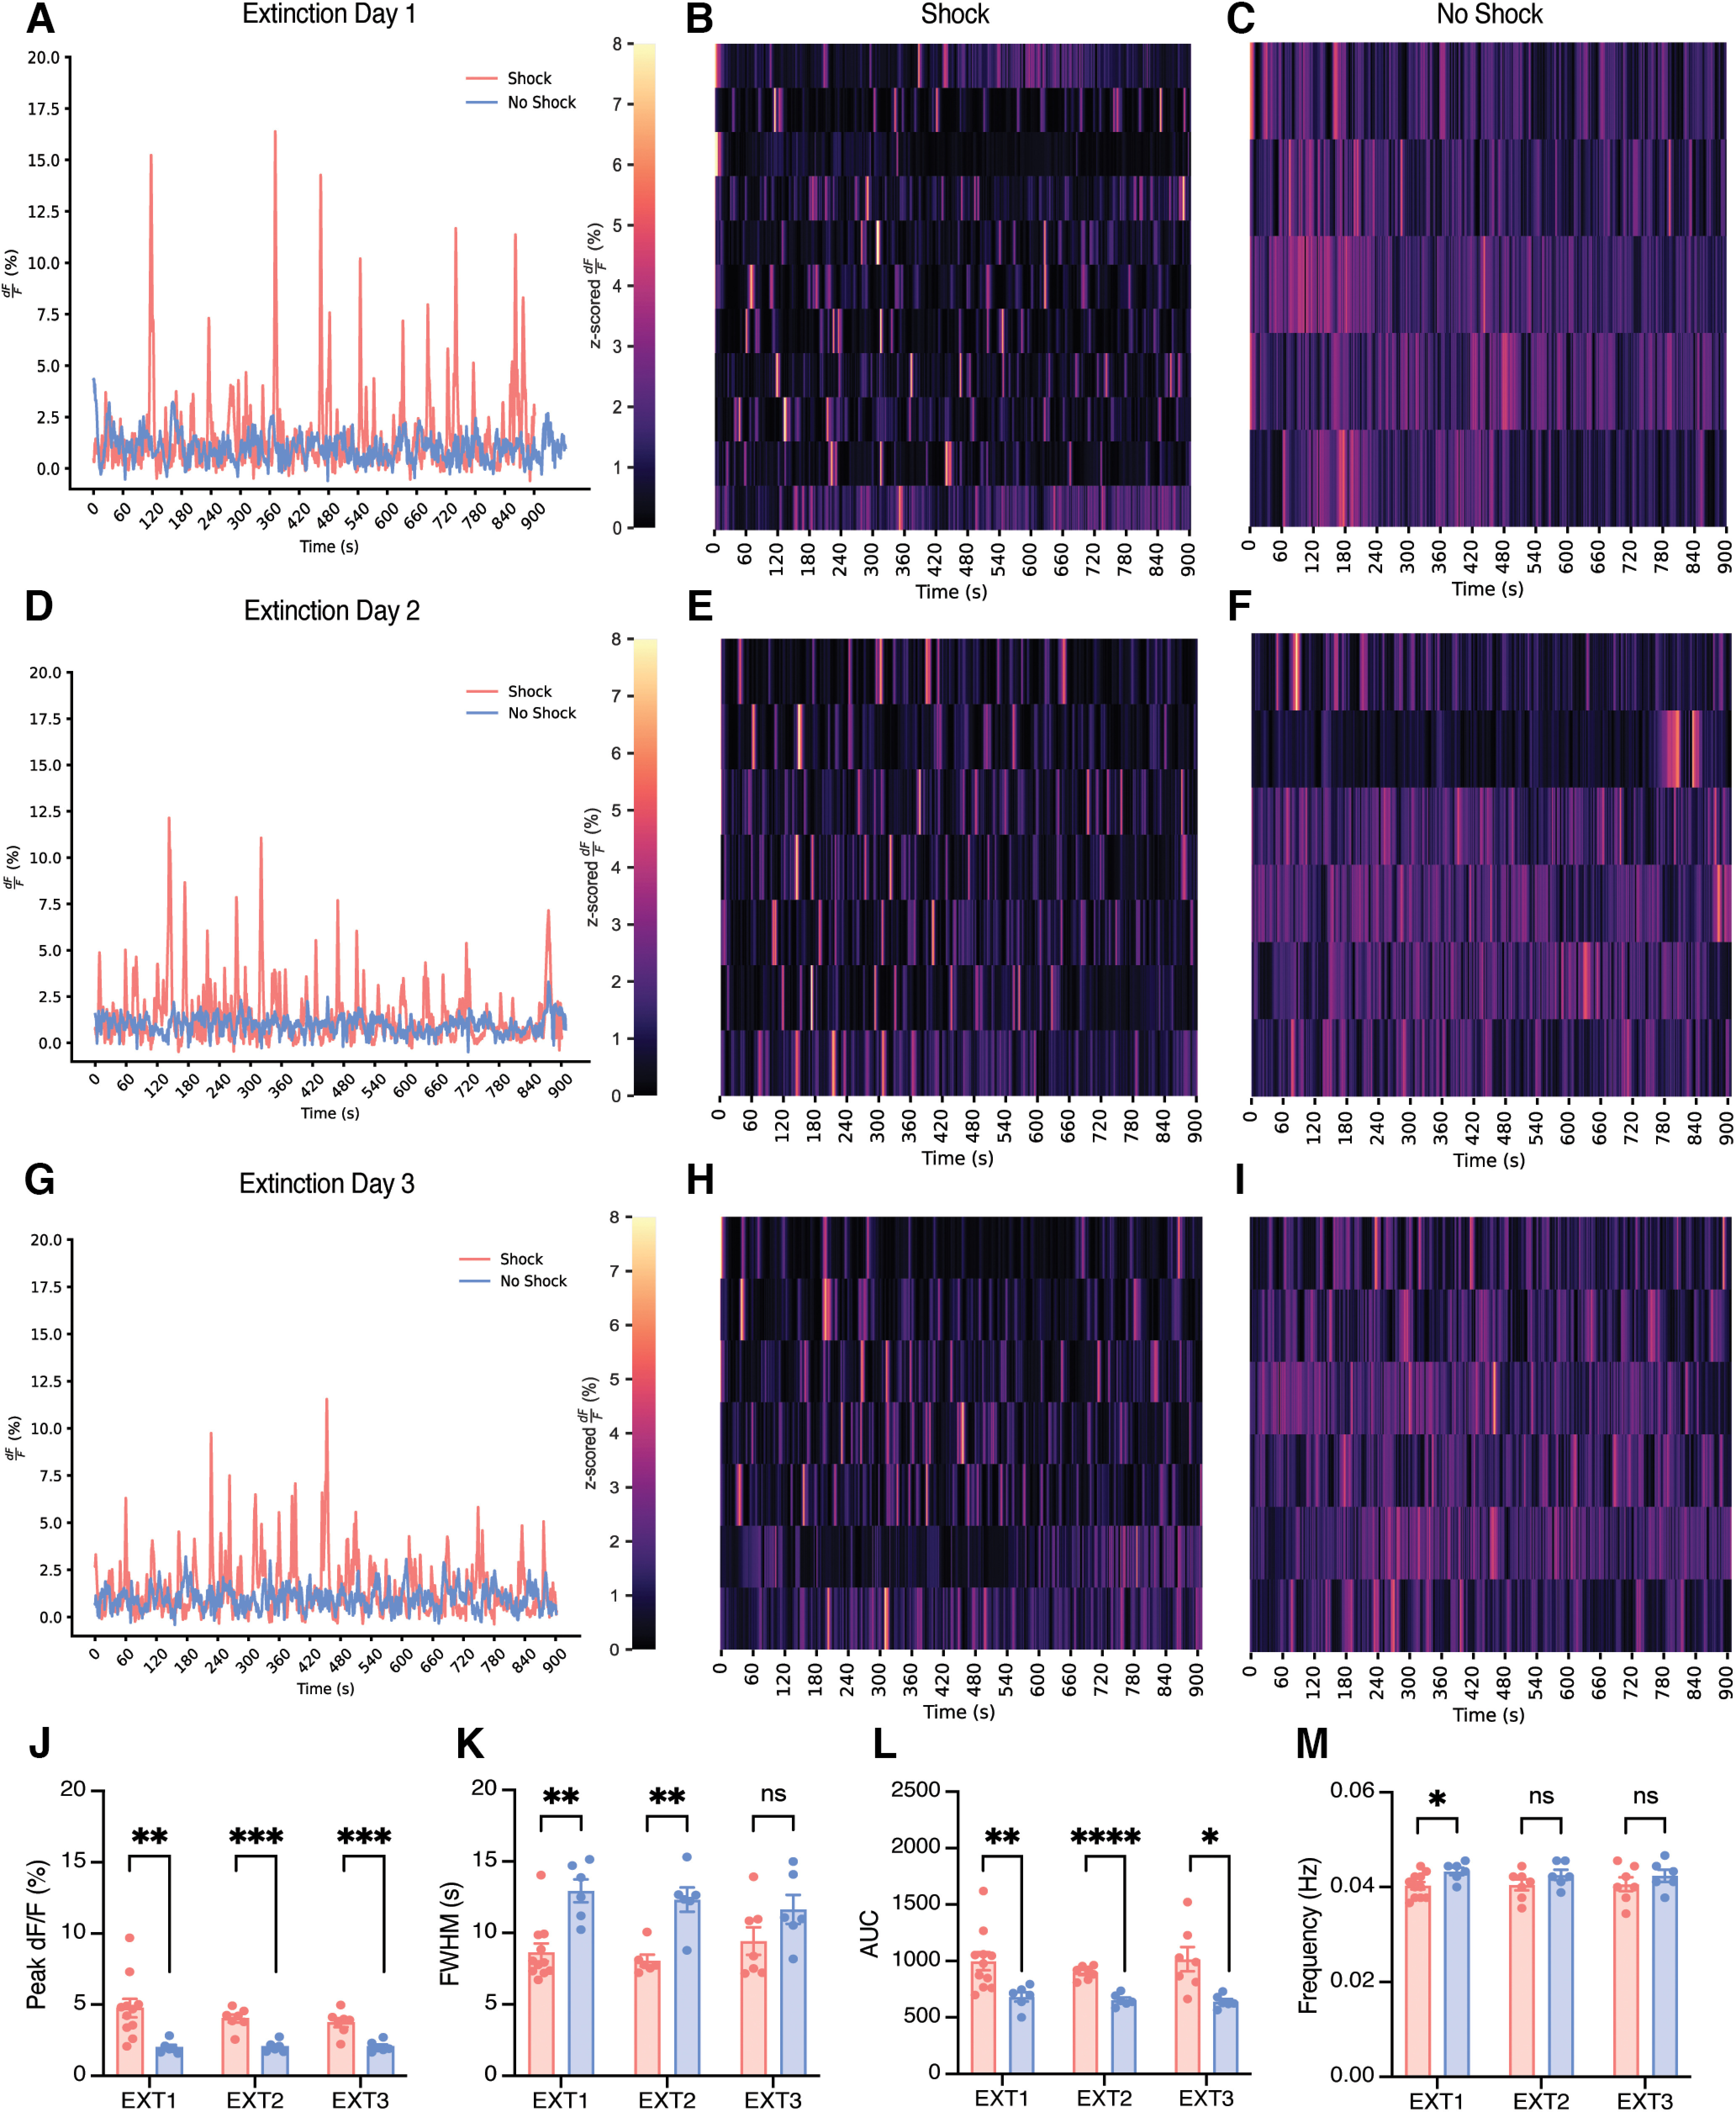
BLA astrocytes in the shock condition exhibit increased peak height, decreased duration, and increased total fluorescence of events compared with no shock, but these do not change across extinction days. A–I, Representative calcium time series (dF/F percentage) for shock and no-shock conditions during the 900 s contextual extinction sessions; extinction day 1 (EXT1) (A), extinction day 2 (EXT2) (D), extinction day 3 (EXT3) (G). B, E, H, The z-scored dF/F (percentage) across extinction for shock condition; each row represents a single subject across time within the session. C, F, I, The z-scored dF/F (percentage) across extinction for the no-shock condition; each row represents a single subject across time within the session. J–M, Calcium event metrics; peak height (J), full-width half-maximum (K), area under the curve (L), and frequency across all three d of extinction (M). Error bars indicate SEM. For t tests, p ≤ 0.05, **p ≤ 0.01, ***p ≤ 0.001, ****p ≤ 0.0001; ns, Not significant. Extinction 1, shock n = 11, no shock n = 6 (For the no-shock group, recording for one animal was ∼90 s short. This animal was excluded from the raster plot and behavioral analysis but still used for event metric calculations). Extinction 2, shock n = 7, no shock n = 6. Extinction 3, shock n = 7, no shock n = 6.