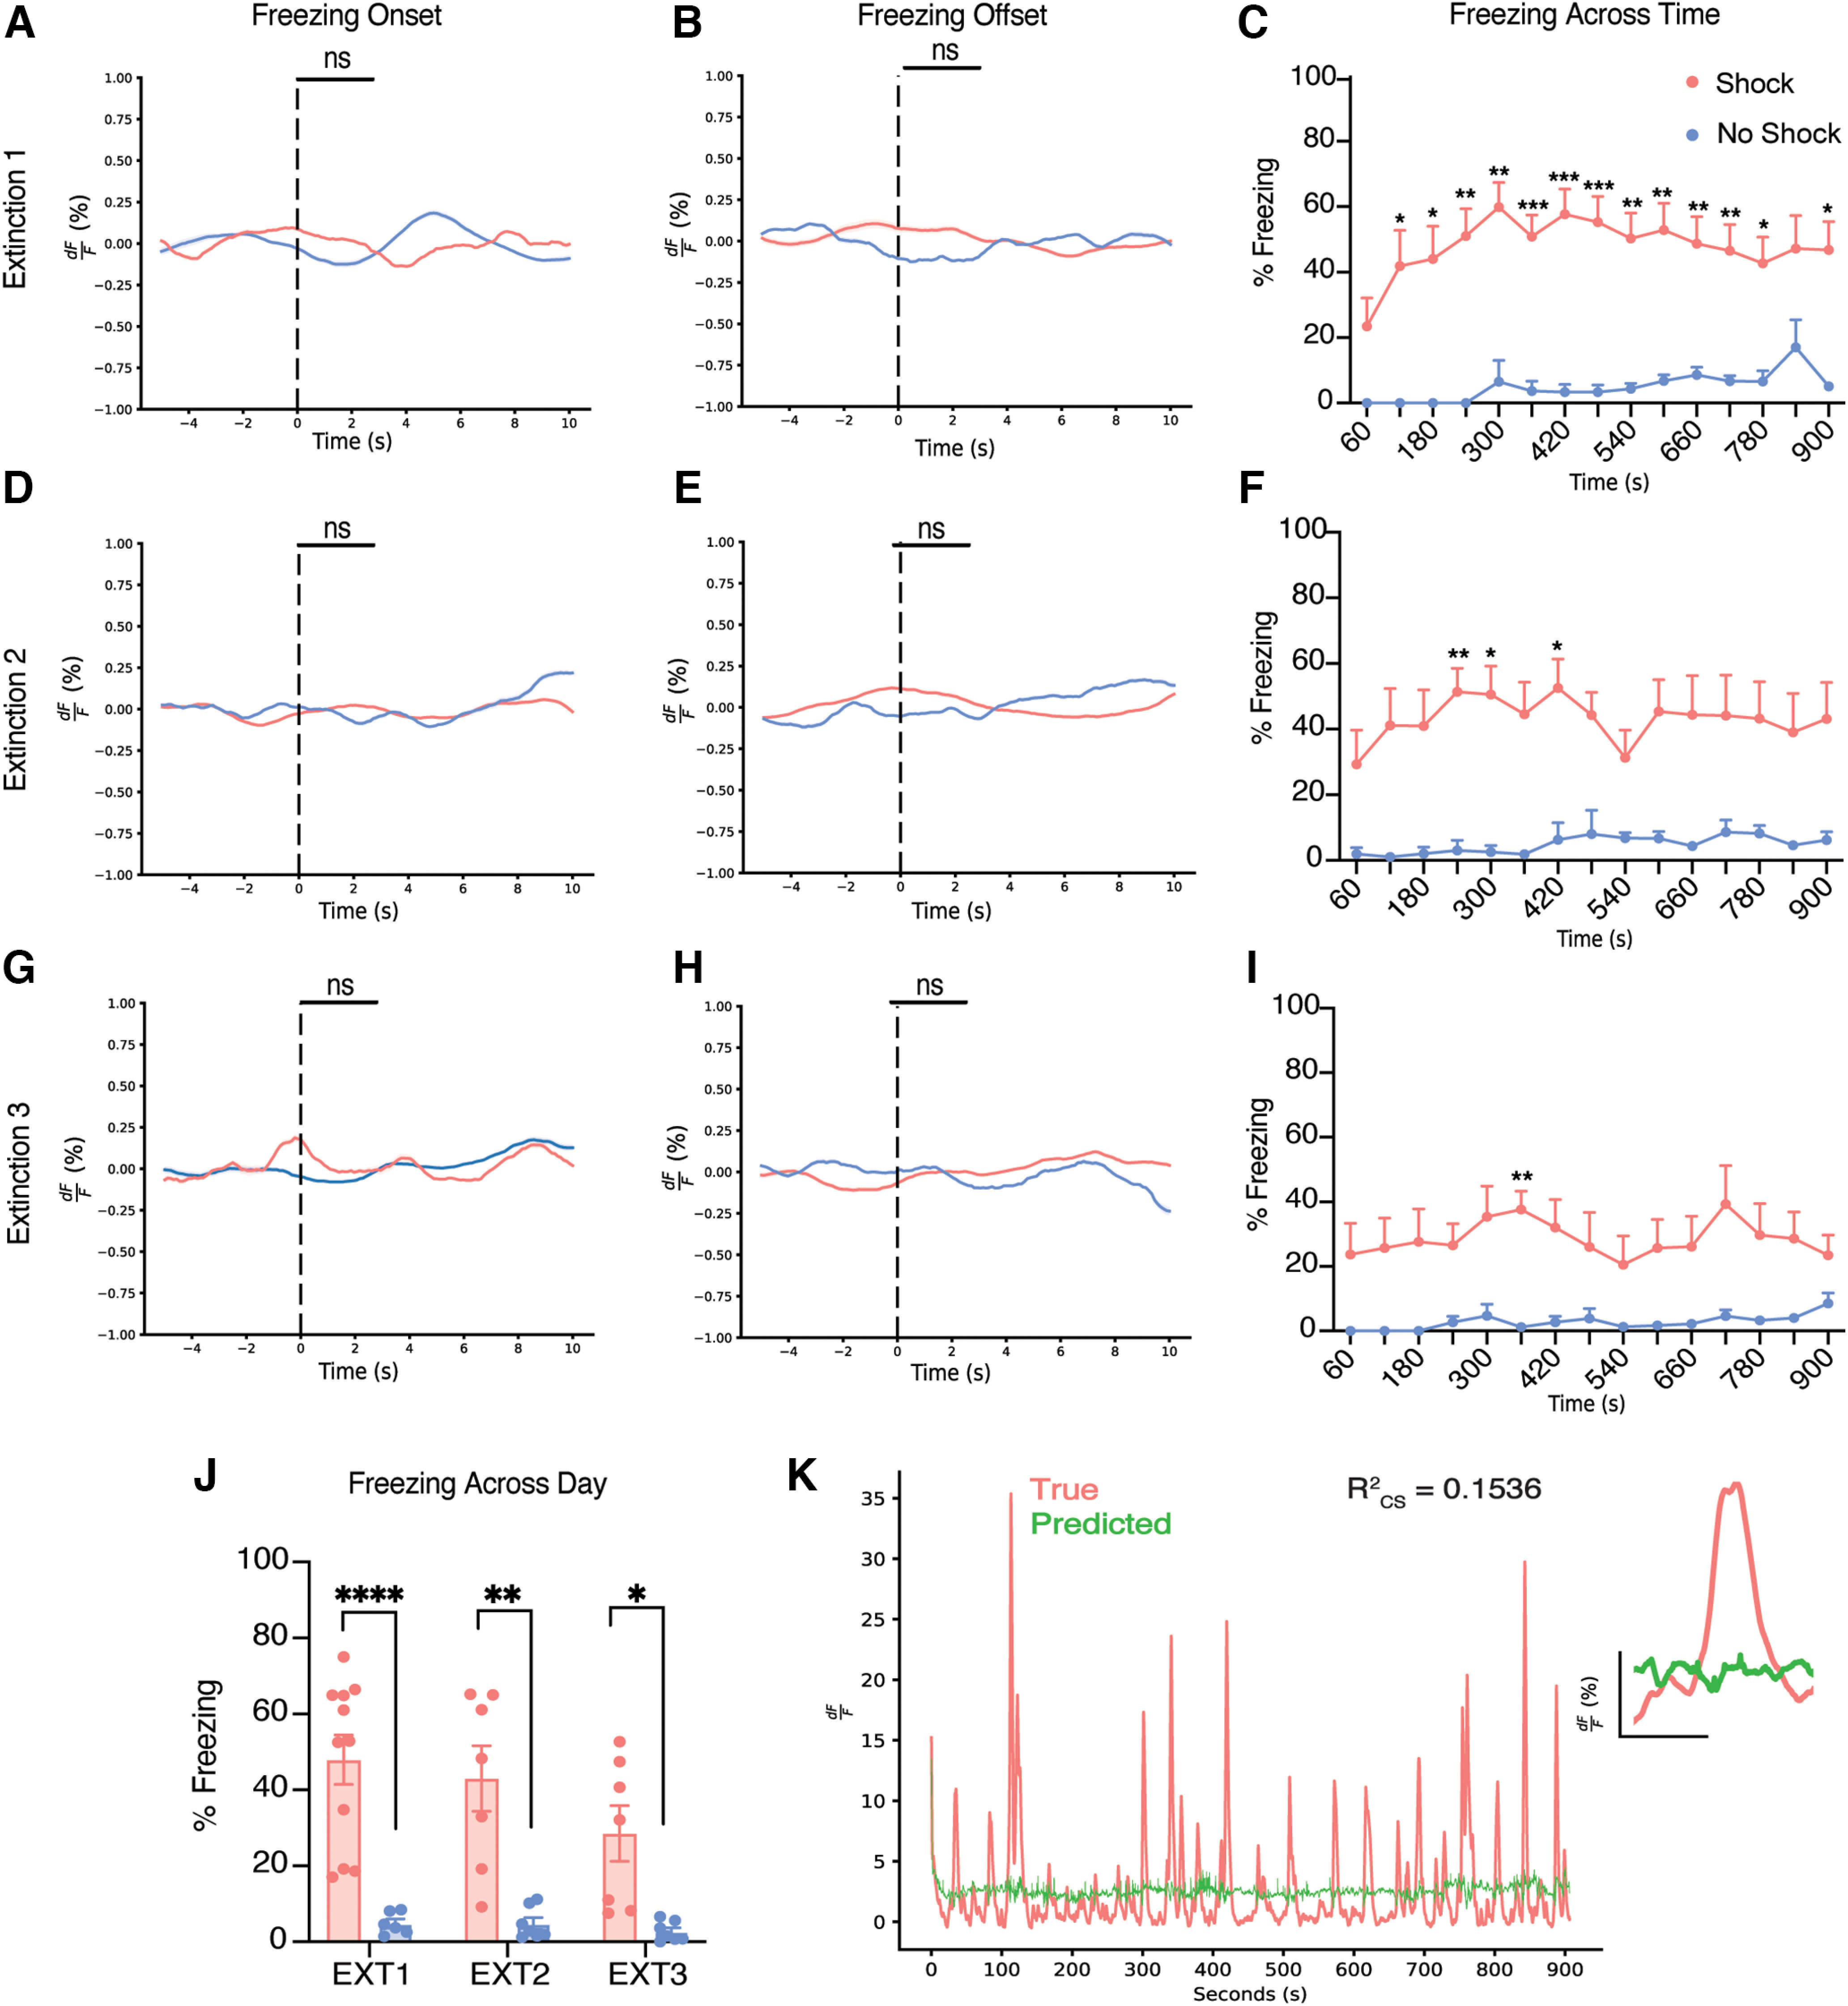
Figure 5.

BLA astrocytic calcium does not respond to the initiation or termination of freezing behavior during extinction sessions. A–I, Perievent analysis for the initiation (A) and termination (B) of freezing behavior, with each event occurring at the dashed line (time = 0) for extinction day 1. Perievent analysis for the initiation (D) and termination (E) of freezing behavior, with each event occurring at the dashed line (time = 0) for extinction day 2. Perievent analysis for the initiation (G) and termination (H) of freezing behavior, with each event occurring at the dashed line (time = 0) for extinction day 3. Percentage freezing across time within extinction day 1 (C), extinction day 2 (F), and extinction day 3 (I). J, Average percentage freezing across 3 d of extinction for shock and no-shock conditions. K, True and predicted traces produced from a generalized linear model. Error bars indicate SEM. For t tests and ANOVAs, p ≤ 0.05, **p ≤ 0.01, ***p ≤ 0.001, ****p ≤ 0.0001; ns, Not significant. For perievent metrics, *95% CI, **99% CI; ***99.9; ns. Extinction 1, shock n = 11, no shock n = 6. (For the no-shock group, the recording for one animal was ∼90 s short. This animal was excluded from the raster plot and behavioral analysis but still used for event metric calculations). Extinction 2, shock n = 7, no shock = 6. Extinction 3, shock n = 7, no shock n = 6.
