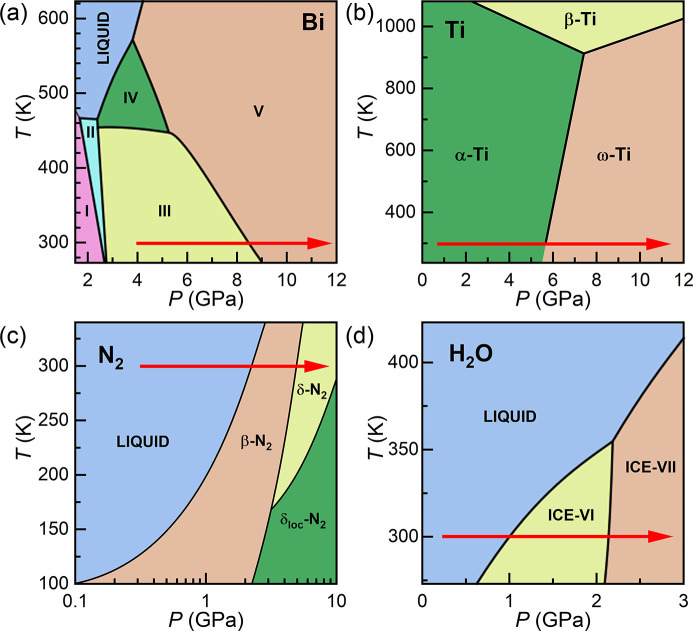
Figure 4.
Phase diagrams of (a) Bi, (b) Ti, (c) N2 and (d) H2O, which are the phase transforming materials studied in this work. The red arrows show the ideal path taken during dDAC compression, highlighting the phase transitions targeted in these experiments. Phase diagrams are modified from the following references: Klement et al. (1963 ▸), Zhang et al. (2008a ▸), Bini et al. (2000 ▸), Pistorius et al. (1968 ▸).

