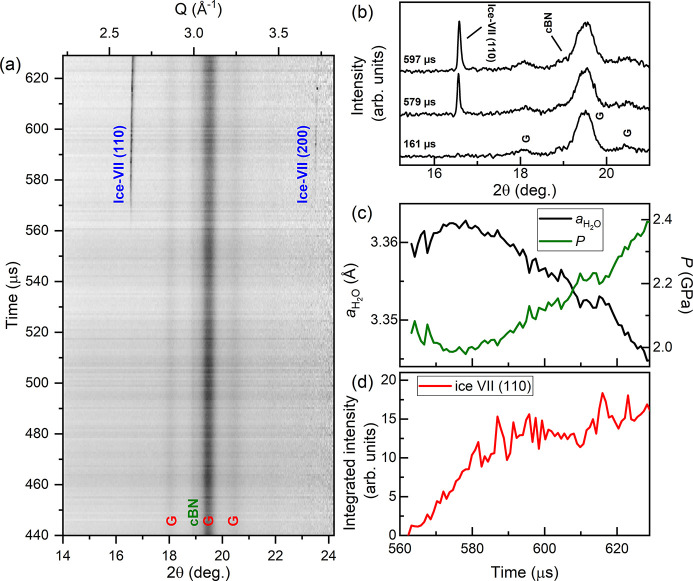
Figure 9.
Dynamic compression of H2O. The panels show (a) integrated XRD data as a function of time, (b) selected integrated patterns showing the growth of the ice-VII reflection during compression, (c) the lattice parameter and corresponding pressure of ice-VII and (d) the integrated intensity of the (110) ice-VII reflection as a function of time. In (c), the pressure is determined using the EoS of ice-VII (Klotz et al., 2017 ▸). In (a) and (b), G indicates reflections from the gasket.

