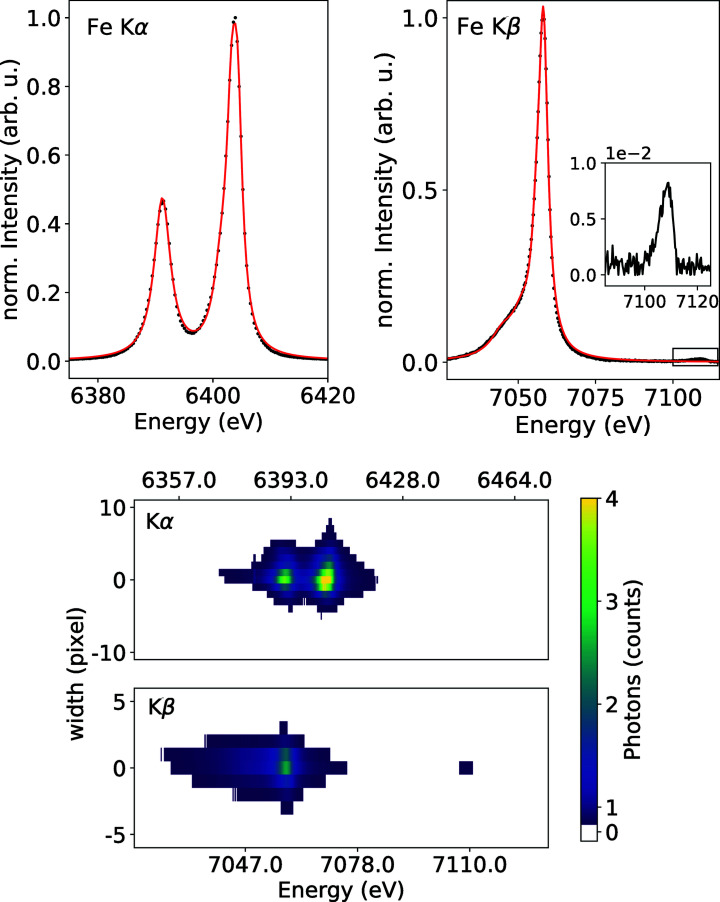
Figure 3.
Upper figures: measured XES spectra from the Fe foil (black, dotted) for the Kα (left) and Kβ lines including the background-corrected vtc signal (right), which were line-fitted using a combination of multiple overlapping Lorentzian peaks (red). Spectra including fitted Lorentzians for Ni, Co and Ge are shown in Figs. S3, S4 and S5. Lower figures: example of a 2D Jungfrau image showing mean photon counts per pulse reflected from an Fe foil and at full beamline transmission. Top: Kα. Bottom: Kβ including vtc.

