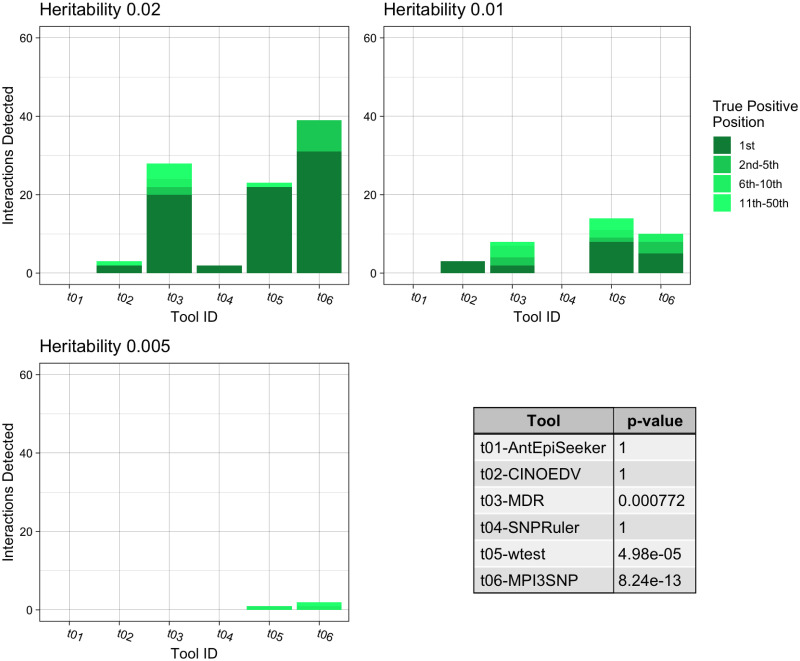
Fig 4. Summary of the pure epistasis results for third order interactions.
The three bar charts show the number of True Positive interactions discovered and the position that the algorithm ranked it amongst combinations with noise loci. Each chart shows a different heritability for the interaction, with higher heritability explained making it more prominent against random noise. The table shows the results of a Mann-Whitney U Test comparing the non-normal distribution of True Positive ranks for a single tool against the distribution of True Positive ranks for all other tools.

