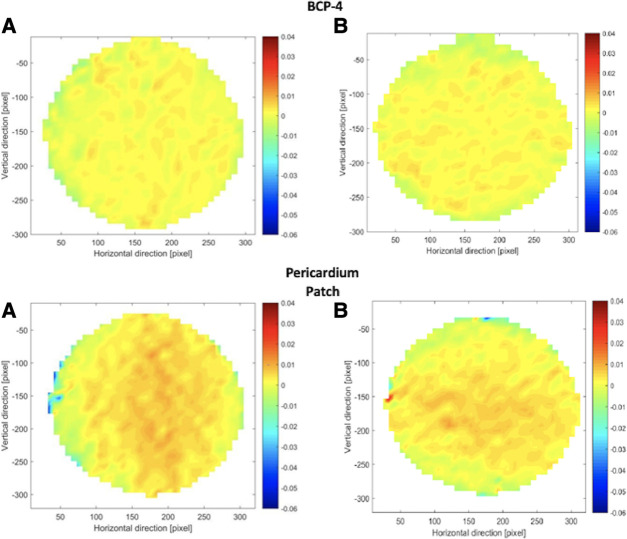
Figure 7.
Strain distribution maps for BCP-4 and pericardium patch. For each patch, all (A) show the strain in the horizontal direction and all (B) show the strain in the vertical direction. The strain map is calculated from the preloaded state (approximately p = 2 mmHg) until a pressure of 80 mmHg. BCP, bacterial cellulose patch.

