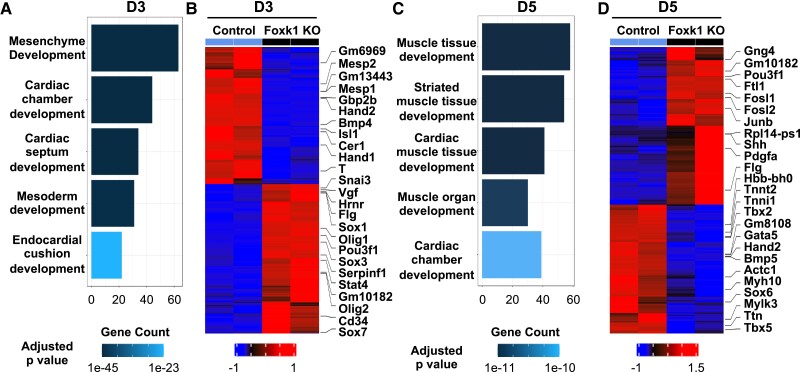
Figure 2.
FOXK1 regulates cardiac developmental transcriptional networks. (A, C) Gene ontology (GO) pathway analysis highlights pathways and development related terms in D3 and D5 control EBs, the x-axis represents the counts of genes in each GO term. The colour scale shows the increased significance of biological processes using the over-representation test with an adjusted P < 0.05. (B, D) The heatmap represents up-regulated and down-regulated in the control EBs vs. the Foxk1 KO EBs at D3 and D5, respectively. The heatmap colour scheme key is provided, with red representing up-regulated and blue representing down-regulated genes.

