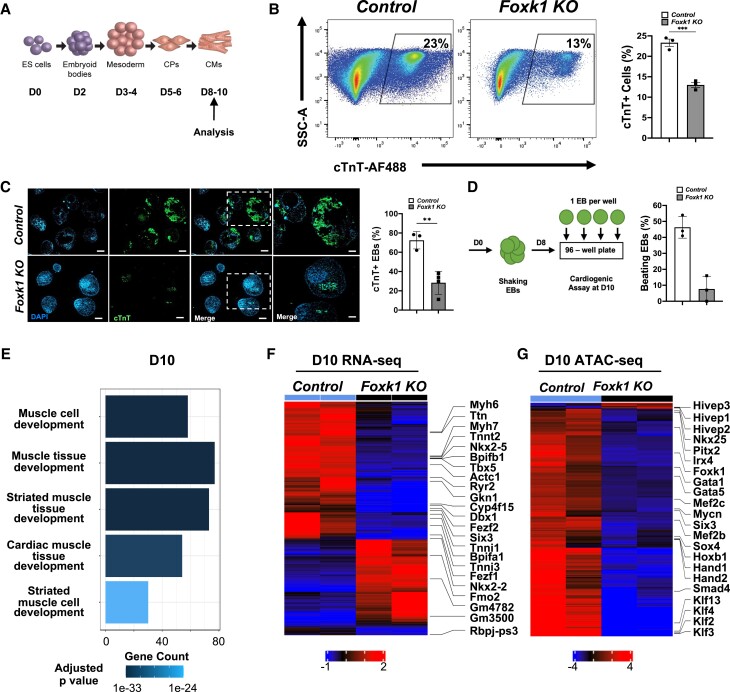
Figure 4.
FOXK1 regulates cardiogenesis in differentiating EBs. (A) Schematic of embryoid bodies53 during in vitro differentiation with notation of cardiac milestones. (B) Representative flow cytometry profile of control and Foxk1 KO D10 EBs with quantification of the results. Note the significant decrease in cTnT+ cells in the Foxk1 KO group compared to the control (n = 3, *P < 0.05). (C) Immunohistochemical analysis of D10 EBs demonstrates that Foxk1 KO EBs have perturbed cardiogenesis compared to the control group as assayed by cTnT staining. Quantification of the immunohistochemical results demonstrates normal cardiac differentiation in Day 10 EBs in control group that is significantly reduced in the absence of FOXK1 (n = 3, *P < 0.05). (D) Schematic of control and Foxk1 KO EBs, cardiogenic beating assay, and quantification of results. Note the significant decrease in the number of beating EBs at D10 of differentiation in the Foxk1 KO EB group compared to control (n = 3, *P < 0.05). Statistical test: Student’s t-test. Data are presented as mean ± SEM. (E) Pathway analysis highlights GO pathways and development related terms in D10 control EBs, the x-axis represents the counts of genes in each GO term. The colour scale shows the increased significance of the biological processes using the over-representation test with an adjusted P < 0.05. (F) The heatmap shows significantly (adjusted P < 0.05) differentially expressed transcripts up-regulated and down-regulated with a two-fold between control EBs vs. Foxk1 null EBs at D10. Red represents up-regulation of transcripts and blue represents down-regulation of transcripts. (G) The heatmap represents a significant (adjusted P < 1e−04) change in chromatin accessibility at D10 for control and Foxk1 KO. Red represents an increase in accessibility and blue represents reduced accessibility for the transcription factor.

