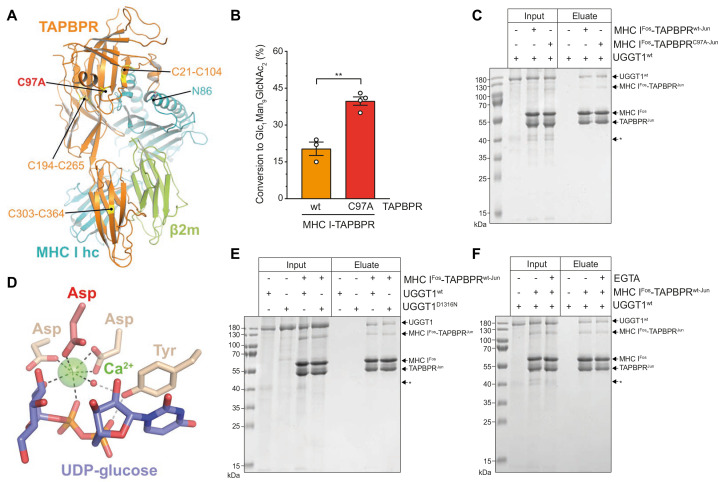
Figure 4. The interaction between UGGT1 and TAPBPR is independent of Cys97 and Ca2+.
(A) Cartoon representation of the MHC I-TAPBPR complex (PDB ID: 5opi). Disulfide bridges in TAPBPR and C97, which was mutated to alanine, are shown as sticks and highlighted in yellow. The glycosylated N86 (depicted as sticks) of the MHC I heavy chain (hc) lies in the vicinity of C97. (B) UGGT1wt-catalyzed (1 µM) reglucosylation of Man9GlcNAc2-HLA-A*68:02 bound to TAPBPRwt (3 µM) or TAPBPRC97A (3 µM). Data represent mean ± SD (n=3 and 4). Statistical analysis was performed using unpaired t-test. Asterisks indicate the level of significance (p-values): **p≤0.01. (C) Pull-down experiment with UGGT1wt (3 µM, present in each lane) using Twin-Strep-tagged Man9GlcNAc2-HLA-A*68:02-TAPBPR complexes (5 µM) captured on Strep-Tactin Sepharose. (D) Ca2+ (green sphere) coordination in the active site of the Thermomyces dupontii UGGT glucosyltransferase domain (PDB ID: 5h18). The side chain of the corresponding aspartate residue that has been mutated to asparagine in human UGGT1D1316N (see panel (F)) is shown in red. The red sphere represents a water molecule that occupies one of the coordination sites. (E) Pull-down experiment with UGGT1wt (5 µM) and the catalytically inactive mutant UGGT1D1316N (5 µM) using Twin-Strep-tagged Man9GlcNAc2-HLA-A*68:02-TAPBPRwt complex (3 µM) in the presence of 5 mM CaCl2. Eluates of the pull-down experiments were analyzed by SDS-PAGE (12.5%, non-reducing, Coomassie-stained). (F) Ca2+ dependence of UGGT1wt (3 µM) binding to Man9GlcNAc2-HLA-A*68:02-TAPBPRwt (5 µM) was analyzed in presence (+) and absence (-) of EGTA. The asterisk (*) indicates a degradation product of UGGT1, representing the glycosyltransferase domain. The data are representative of two independent experiments. Abbreviation: kDa: kilodalton. The numbering of TAPBPR refers to the mature protein as defined by N-terminal sequencing (Zhang and Henzel, 2004).


