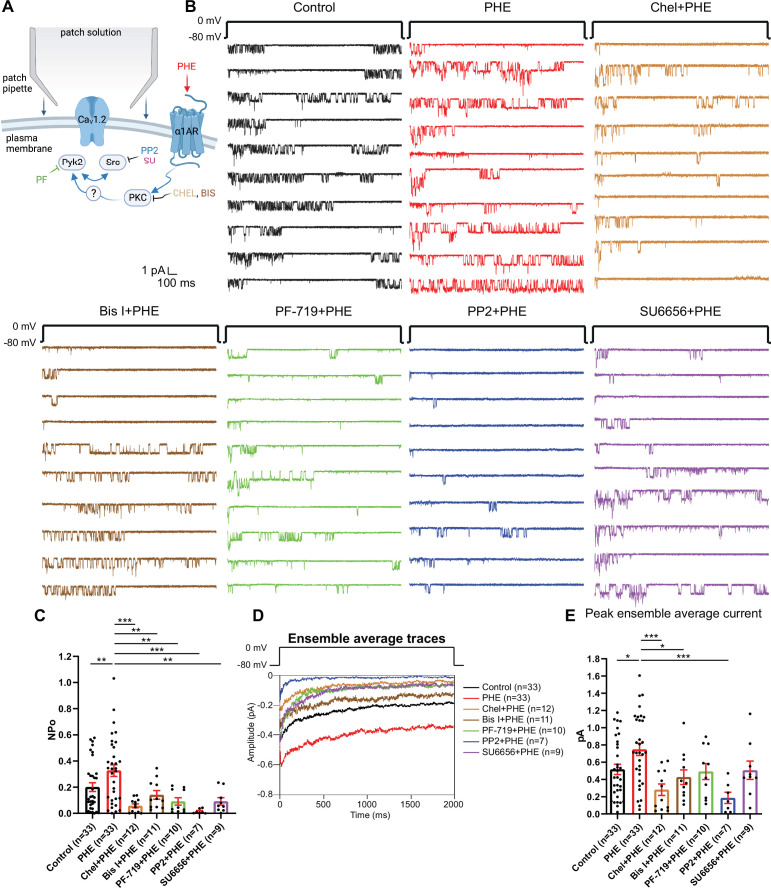
Figure 2. The phenylephrine (PHE)-induced increase in NPo of L-type Ca2+ channels (LTCCs) in hippocampal neurons requires PKC, Pyk2, and Src.
(A) Neurons were preincubated with vehicle, PHE, and the indicated kinase inhibitors before seal formation. (B) Ten consecutive traces from representative cell-attached single-channel recordings of LTCCs with vehicle (0.1% DMSO; black) and PHE either alone (red) or with the PKC inhibitors chelerythrine (Chel; 10 µM; bright brown) and bisindolylmaleimide I (Bis I; 100 nM; dark brown), the Pyk2 inhibitor PF-719 (1 µM; green), or the Src inhibitors PP2 (10 µM; blue) and SU6656 (10 µM; purple). (C) The increase in NPo by PHE was blocked by all inhibitors. F6,108 = 6.434. Control vs. PHE, p = 0.0076; PHE vs. Chel + PHE, p = 0.0001; PHE vs. Bis I + PHE, p = 0.0076; PHE vs. PF-719 + PHE, p = 0.0018; PHE vs. PP2 + PHE, p = 0.0003; PHE vs. SU6656 + PHE, p = 0.0022. (D) Ensemble averages during depolarization. (E) The increase in ensemble average peak currents by PHE was blocked by PKC inhibitors chelerythrine, bisinolylmaleimide I, and Src inhibitor PP2. F6,108 = 4.839. Control vs. PHE, p = 0.0242; PHE vs. Chel + PHE, p = 0.0004; PHE vs. Bis I + PHE, p = 0.0242; PHE vs. PF-719 + PHE, p = 0.0723; PHE vs. PP2 + PHE, p = 0.0006; PHE vs. SU6656 + PHE, p = 0.0723. (C, E) Data are presented as means ± standard error of the mean (SEM). n represents the number of cells (*p ≤ 0.05, **p ≤ 0.01, ***p ≤ 0.001; analysis of variance [ANOVA] with post hoc Holm–Sidak’s multiple comparisons test). Panel A was created using Biorender.com.


