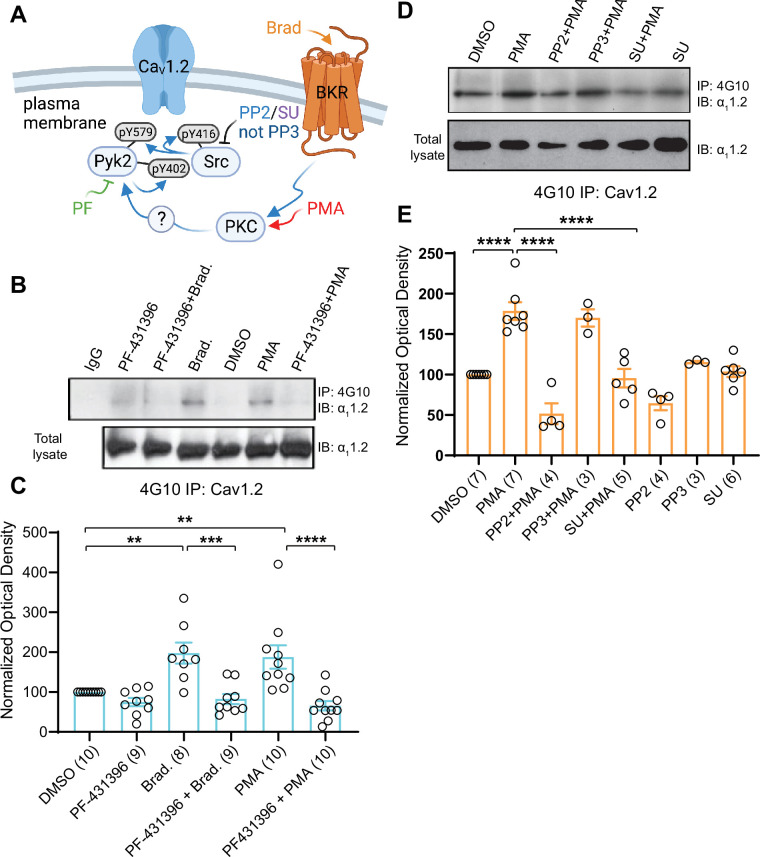
Figure 9. Increase in α11.2 tyrosine phosphorylation by PKC is blocked by inhibitors or Pyk2 and Src. PC12 cells were treated as in Figure 8 for analysis of tyrosine phosphorylation by immunoprecipitation (IP) with 4G10 and immunoblotting (IB) with anti-α11.2.
IgG indicates control IP with non-immune mouse IgG. Vehicle (0.02% DMSO), PF-431396 (3 μM), PP2 (10 μM), PP3 (10 μM), or SU6656 (SU, 10 μM) were applied 5 min before phorbol-12-myristate-13-acetate (PMA) or bradykinin (Brad.) when indicated. (A) Schematic diagram depicting the bradykinin receptor–PKC–Pyk2/Src–CaV1.2 signaling cascade and drugs used to target each molecular entity. (B, D) Upper panels: pY of α11.2 determined by 4G10 IP and α11.2 IB. Lower panels: Levels of total α11.2 detected with anti-α11.2 in corresponding lysates. (C, E) Ratios of pY signals in 4G10 IPs by IB with anti-α11.2 to α11.2 signals in lysates, normalized to control. Data are presented as mean ± standard error of the mean (SEM). Number (n) of independent experiments for each condition are indicated inside bars. Statistical analysis was by analysis of variance (ANOVA) with post hoc Bonferroni’s multiple comparisons test. (C) F5,50 = 10.65. DMSO vs. Brad., p = 0.0021; DMSO vs. PMA, p = 0.0036; Brad. vs. PF-431396 + Brad., p = 0.0003; PMA vs. PF-431396 + PMA, p < 0.0001. (E) F7,31 = 23.67. DMSO vs. PMA, p < 0.0001; PMA vs. PP2 + PMA, p < 0.0001; PMA vs. SU + PMA, p < 0.0001 (**p ≤ 0.01, ***p ≤ 0.001, ****p ≤ 0.0001). Bradykinin- and PMA-induced α11.2 tyrosine phosphorylation was blocked by PF-431396, SU6656 and PP2 but not the inactive PP3. Panel A was created using Biorender.com.

