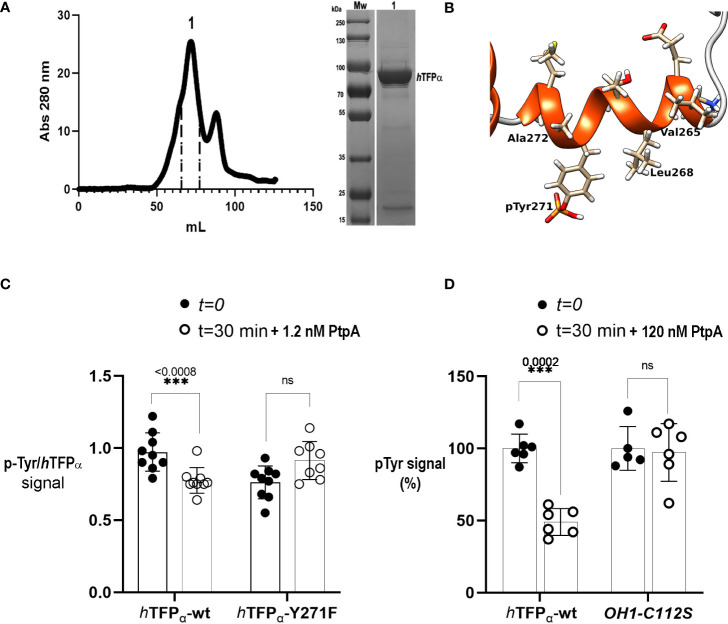
Figure 3.
Mycobacterial PtpA activity and interaction with recombinant hTFP α. (A) SEC profiles of recombinant hTFPα purification on Superdex 200 column. SEC was performed in an AKTA Basic system (GE Healthcare), injecting a sample volume of 5 mL in a Superdex 200 16/60 preparative grade column (GE Healthcare). Elution was carried out with two-bed column volumes of the equilibration buffer, and fractions containing the recombinant protein were pooled (fractions indicated in peak 1, elution volume 72 mL). The apparent molecular weight was calculated using the following equation K av = −0.3872 (logMw) + 2.2662 corresponding to the previous calibration curve of the column using SEC molecular weight (SIGMA). (B) Cartoon representation of the helix-10 of the hTFPα containing the p-Tyr 271 phosphorylated by Jak. The residues of the helix are represented as sticks. The figure was generated with UCSF Chimera [Pettersen EF, 2004 et al.]. (C) Evaluation of dephosphorylation of hTFPα-wt and hTFPα-Y271F by PtpA. The graph shows the mean of p-Tyr/hTFPα ratios ± SD of three independent experiments including three technical replicates. The asterisks indicate the p-value obtained after an unpaired t-test. Equal amounts of the recombinant hTFPα and hTFPα -Y271F previously phosphorylated by Jak were incubated with 1.2 nM of PtpA for 30 min at 37°C in solution. After this time, spots of 5 μL of the reaction were applied in a nitrocellulose membrane by triplicates. Dephosphorylation was evaluated by a Dot Blot assay with an anti-p-Tyr antibody and anti hTFPα antibody to determine the ratio between p-Tyr and hTFPα chemiluminescent signals, quantified using ImageJ (Schneider et al., 2012). Figure S11 shows a representative dot blot used in the analysis. (D) Evaluation of PtpA specificity using hTFPα-wt and rOH1-C112S as substrates. The graph shows the obtained p-Tyr signal (expressed as %) after incubation with PtpA. Equal amounts of hTFPα or rOH1-C112S previously phosphorylated by Jak were incubated with 120 nM of PtpA (corresponding to a E:S molar ratio of 1:50) for 30 min at 37°C. Then, spots of 5 μL of the reaction were applied in a nitrocellulose membrane by triplicates to perform a Dot Blot assay using an anti-p-Tyr antibody. Chemiluminescent signals were quantified using ImageJ (Schneider et al., 2012). The average p-Tyr signal at t=0 was considered as 100%. After a two-way ANOVA a significant difference (***) was detected between both groups (hTFPα or rOH1-C112S). The asterisks represent the p-value obtained after an unpaired t-test between t=0 and t=30 minutes, and ns: not statistically significant. Figure S12 shows a representative dot blot used in the analysis.

