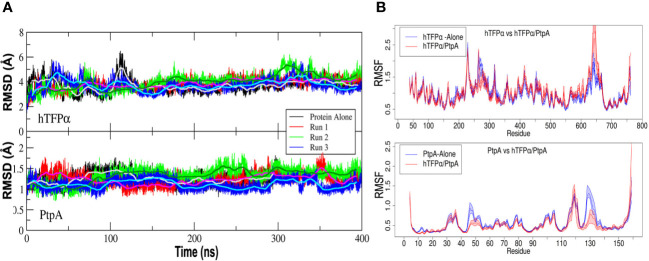
Figure 4.
Mycobacterial PtpA and hTFPα form a stable complex that involves PtpA active site. (A) Graphical representation of the Root Mean Square Deviation (RMSD) along time (nanoseconds) for three parallel molecular dynamics simulations of hTFPα (up) and PtpA (down) proteins alone in solution, and forming part of the interacting complex (run1, run 2 and 3). (B) Graphical representation of the Root Mean Square Fluctuation (RMSF) of the backbone atoms along the trajectory (average over each residue) for hTFPα (up) and PtpA (down) proteins alone in solution (blue curve) and the three simulations together (red curve). The RMSF values were calculated over a moving window of 10 ns with a step of 2 ns during the last 200 ns of simulation. Each curve is plotted from the percentile 25 to the percentile 75 of the obtained values, with the median at the center. For the calculation of the statistical values, only one trajectory was taken into account for the proteins alone, while for the complex, three trajectories were taken into account.

