Figure 5.
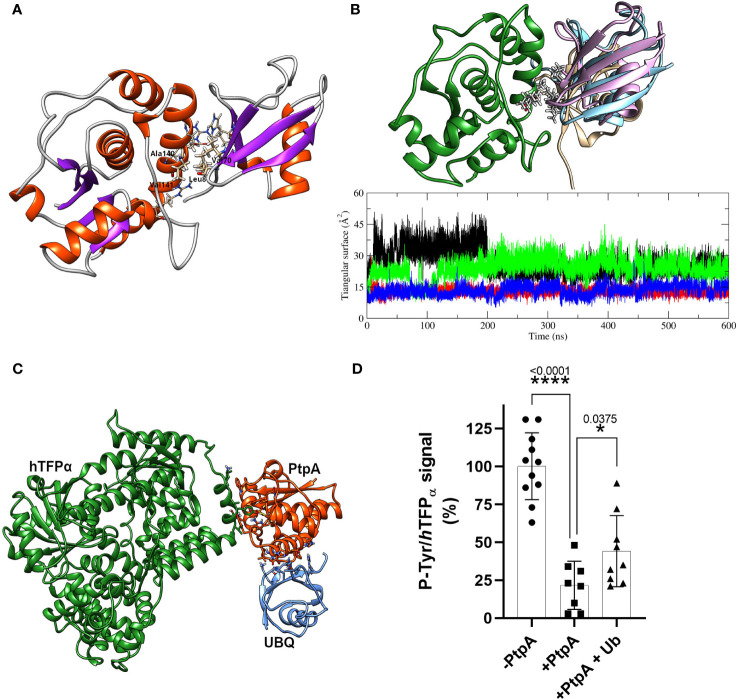
PtpA-ubiquitin interaction assays and evaluation of the ubiquitin effect on phosphatase activity. (A) Best PtpA/Ub complex structure obtained after the protein/protein docking protocol. The residues involved in the hydrophobic core are labeled and plotted with thicker bonds, while the residues involved in the h-bonds interactions are plotted with thinner bonds. (B) The upper structure represents the final configuration of the three MD runs for ubiquitin molecules (1-pink, 2- brown, and 3-light blue) with respect to PtpA (green). For the PtpA MD, only one conformation is shown since the changes in its conformation were negligible between the three runs. The graphical inset represents the triangular area of the PtpA binding site (defined in the text) along the trajectory of the simulation of PtpA in solution (black curve) and in the three simulations of the complex PtpA/Ub (1-red, 2-green, and 3-blue). (C) Hypothetical complex of the hTFPα/PtpA/Ub. The image shows that there are no steric interferences between proteins suggesting that the complex could form. (D) Dephosphorylation of recombinant hTFPα in the presence or absence of ubiquitin. Equal amounts of the recombinant hTFPα were resolved by SDS-PAGE, transferred to PVDF membrane and blocked, and treated at 37°C for 30 min with a buffer containing 0 μM PtpA-wt (-PtpA), 1.5 μM PtpA (+PtpA), and 1.5 μM PtpA preincubated with ubiquitin for 15 min (+PtpA and Ub). Dephosphorylation was evaluated with the anti-p-Tyr antibody. The same membranes were re-probed with anti hTFPα antibody to determine the ratio between p-Tyr and hTFPα chemiluminescent signals (expressed as %). Error bars represent experimental variability detected between three independent experiments, and the asterisks are the p-value obtained after an unpaired t-test.

