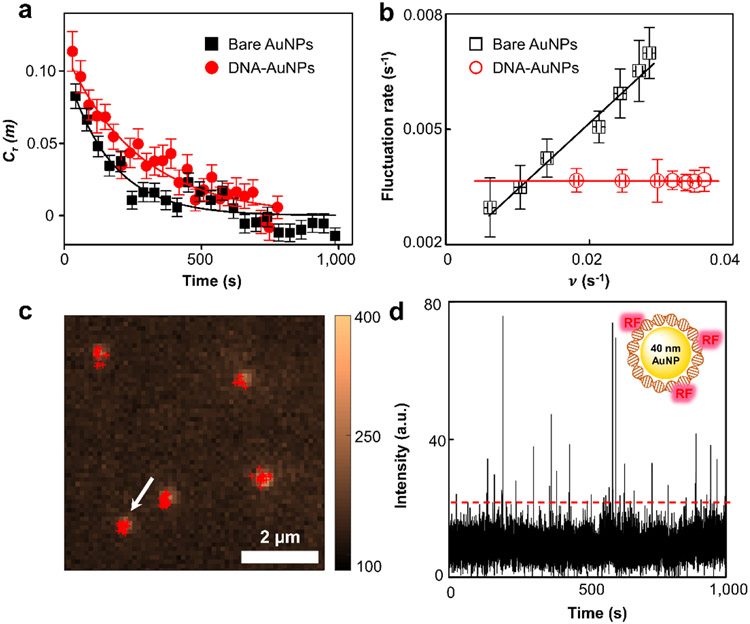
Figure 3.
Oxidation reaction occurs in the DNA corona phase. (a) Autocorrelation function of the microscopic reaction time from single AuNP@DNA catalyzing the oxidation of 800 μM AR. The x-axis is a conversion from the turnover index to reaction time using the average turnover time of each nanozyme and averaged over >80 nanozymes. Solid curves are single exponential fits with decay constants of 163 ± 25 s, and 269 ± 22 s for 5 nm AuNP and AuNP@DNA, respectively. (b) Dependence of the reactivity fluctuation rates on the turnover rates of 5 nm AuNP and AuNP@DNA in AR oxidation. The y-axis is the inverse of the reactivity fluctuation correlation time obtained from . Solid lines are linear fits reflecting the adsorbate-surface interactions. (c) AR (400 μM) oxidation by 40 nm AuNP@DNA. 40 nm AuNPs are visible because of their photoluminescence signals. Red crosses are the centroids of generated RFs by fitting their emission signals with two-dimensional Gaussian functions. (d) Intensity versus time trajectory for the single 40 nm AuNP@DNA marked by the arrow in (c). Fluorescence intensity is integrated after subtracting the background emission signal from 40 nm AuNP.

