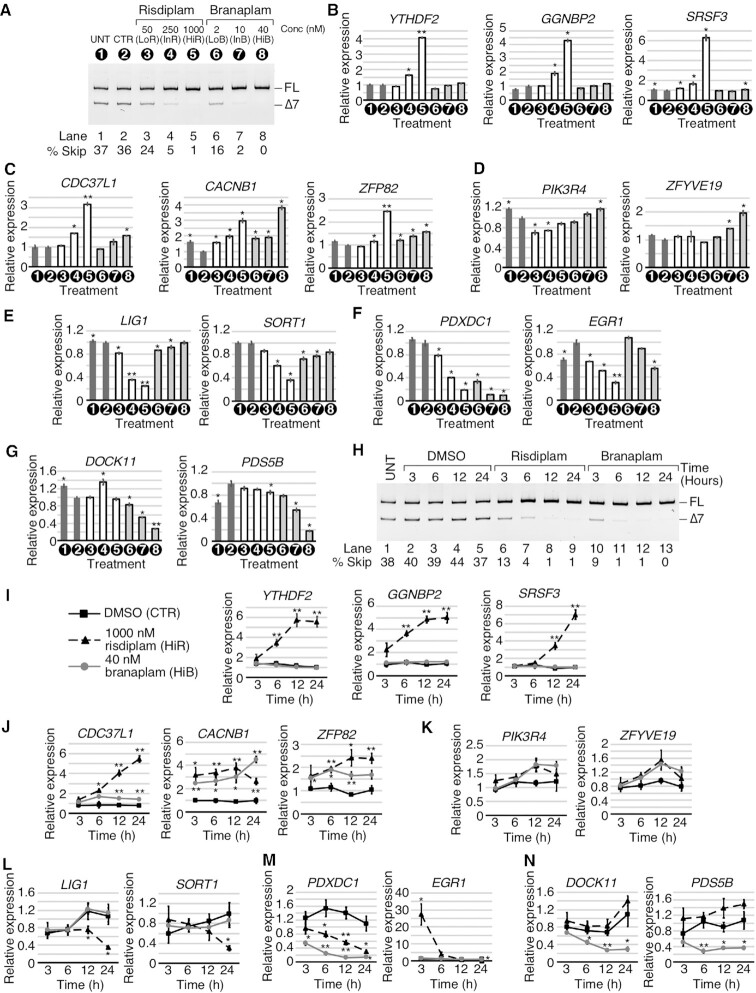
Figure 2.
Risdiplam and branaplam affect gene expression in a concentration-dependent manner. (A) Representative gel image showing the splicing pattern of SMN2 exon 7 in GM03813 fibroblasts treated with different concentrations of risdiplam and branaplam. Numbers in black circles represent treatment type and are used throughout the figure. Other labeling is the same as in Figure 1B. (B–D) qPCR results measuring the expression of specific genes that were upregulated by risdiplam treatment only (B), by both risdiplam and branaplam treatments (C) or by branaplam treatment only (D). The gene name is indicated above each graph. Treatment types are indicated under the x-axis. The y-axis represents the relative expression as compared with control (CTR) DMSO treatment. Error bars indicate the standard error of the mean (SEM); n= 3; *P <0.05; **P <0.01. (E–G) qPCR results measuring the expression of specific genes that were downregulated by risdiplam treatment only (E), by both risdiplam and branaplam treatments (F) or by branaplam treatment only (G). Labeling is the same as in (B–D). (H) Representative gel image showing the splicing pattern of SMN2 exon 7 in GM03813 fibroblasts treated with HiR or HiB at different time points. Treatments and time are indicated at the top of the gel. Other labeling is the same as in Figure 1B. (I–N) qPCR results measuring the expression of the genes examined in (B–G) at different time points. Treatments are marked as indicated in (I). The x-axis represents time of treatment and the y-axis represents relative expression compared with untreated control. Error bars indicate the SEM; n= 3; *P <0.05; **P <0.01.

