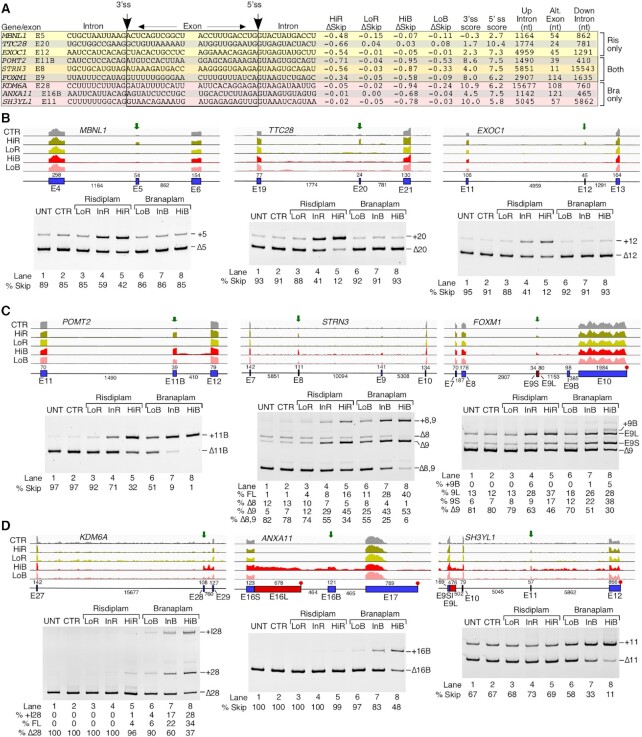
Figure 3.
Risdiplam and branaplam promote off-target exon inclusion. (A) Table summarizing splicing-relevant information regarding the top candidate exons with increased inclusion after HiR treatment only, both treatments and after HiB treatment only. Shown sequences correspond to 12 nt located upstream and downstream of the 3′ss and 5′ss. Intronic and exonic sequences are indicated; in addition, exonic sequences are boxed. The 3′ss and 5′ss are marked by arrows. The identity of each exon is given at the beginning of each row. Whether each exon inclusion was affected by HiR or HiB treatment only, or by both, is denoted at the right side. ΔSkip indicates the change in the proportion of total transcript that has skipping of the indicated exon. 3′ss and 5′ss scores indicate the predicted strength of the splice sites as compared with the consensus sites. The last three columns indicate the sizes of the upstream intron, alternative exon and downstream intron. (B–D) Genomic views of RNA-Seq reads (upper panels) and RT–PCR results (lower panels) examining EIN events that are triggered by HiR only (B), by both HiR and HiB (C) and by HiB only (D) in GM03813 fibroblasts. For genomic views, treatment types are indicated at the left, and exon/intron arrangement at the bottom. Exons are depicted as blue boxes and introns as black lines. Red boxes indicate longer forms of exons that can be generated by usage of an alternative 5′ss or 3′ss. Exon names and sizes are given below and above each exon, respectively. Intron sizes are indicated below each intron. Transcription termination sites are indicated with a red octagon. Green arrows mark the location of treatment-affected exons. For representative gel images showing the splicing pattern of specific exons, labeling is the same as in Figure 1B.

