Figure 6.
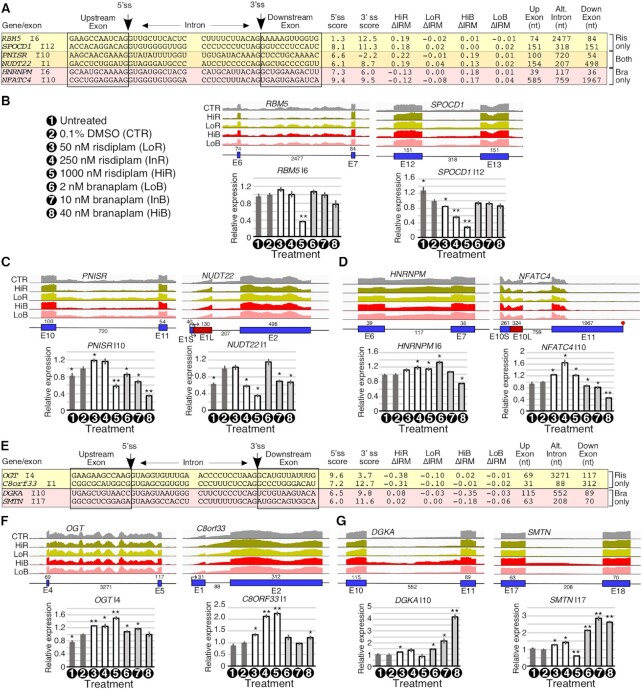
Risdiplam and branaplam trigger changes in intron retention. (A) Table summarizing splicing-relevant information for the top candidate introns with improved removal after HiR only, both treatments or after HiB only. Shown sequences correspond to 12 nt upstream and downstream of the 5′ss and 3′ss that flank the affected intron. The 5′ss and 3′ss scores are given. ΔIRM indicates the change in intron removal after treatment (positive numbers indicate improved removal, and negative numbers indicate retention). The sizes of the upstream exon, affected intron and downstream exon are given. (B–D) Genomic views of RNA-Seq reads (upper panels) and qPCR results (lower panels) examining IRM events affected by HiR only (B), both HiR and HiB (C) or HiB only (D) in GM03813 fibroblasts. For genomic views, coloring and labeling are the same as in Figure 3B–D. For qPCR, the gene symbol and measured intron are indicated above each graph. Treatments are indicated under the x-axis. Treatment symbols are the same as in Figure 2 and are described in the leftmost panel of (B). The y-axis represents the relative expression relative to DMSO-treated (CTR) cells of intron-containing transcripts corrected by total expression of the gene in question. Error bars indicate the SEM; n= 3; *P <0.05; **P <0.01. (E) Table summarizing splicing-relevant information for the top candidate introns with increased retention after HiR only or after HiB only. Table contents are similar to (A). (F, G) Genomic views of RNA-Seq reads (upper panels) and qPCR measuring intron retention (lower panels) of IRT events affected by HiR alone (F) or HiB alone (G). Coloring, labeling and statistics are similar to (B–D).

