Figure 1.
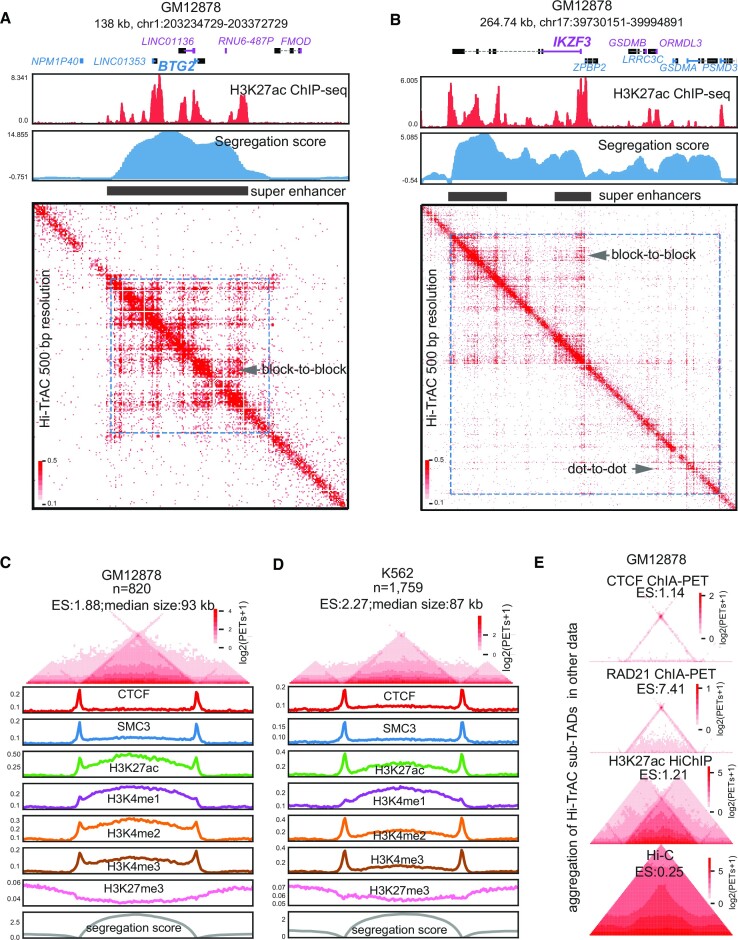
Identification of active sub-TADs by Hi-TrAC. (A) Example of active sub-TAD containing the BTG2 gene locus detected by Hi-TrAC in GM12878 cells. The cLoops2 callDomains module called domains at 1kb resolution (Materials and Methods). The first exon of a gene and its name in the positive strand are indicated by blue color, and the first exon of a gene and its name in the negative strand are indicated by purple color. ENCODE (40) H3K27ac ChIP-seq profiles and the Hi-TrAC domain segregation scores are displayed below the genomic annotations. The filled black rectangle indicates the super-enhancers within the active sub-TADs. Hi-TrAC interaction matrix was shown at 500 bp resolution. The interaction domain is marked as blue dotted frames on the heatmap. The plot was generated by the cLoops2 plot module. (B) Example of active sub-TAD containing the IKZF3 gene locus detected by Hi-TrAC in GM12878 cells. (C) Aggregation analysis of 820 active sub-TADs identified from the Hi-TrAC data in GM12878 cells (Supplemental Table 2). Together with 0.5-fold neighboring upstream and downstream regions, all the Hi-TrAC active sub-TADs were aggregated for visualization (Materials and Methods). ES stands for enrichment scores of interacting PETs within the domains compared to the PETs with one end in the domain and the other outside the domain. The enrichments of various ChIP-seq signals were calculated based on ENCODE ChIP-seq data (40). The analysis was performed with the cLoops2 agg module. (D) Aggregation analysis of 1759 active sub-TADs identified from the K562 Hi-TrAC data (Supplemental Table 2). (E) Aggregation analysis of Hi-TrAC active sub-TADs with CTCF ChIA-PET data (24), RAD21 ChIA-PET data (68), H3K27ac HiChIP data (69) and in situ Hi-C data (21) in GM12878 cells.

