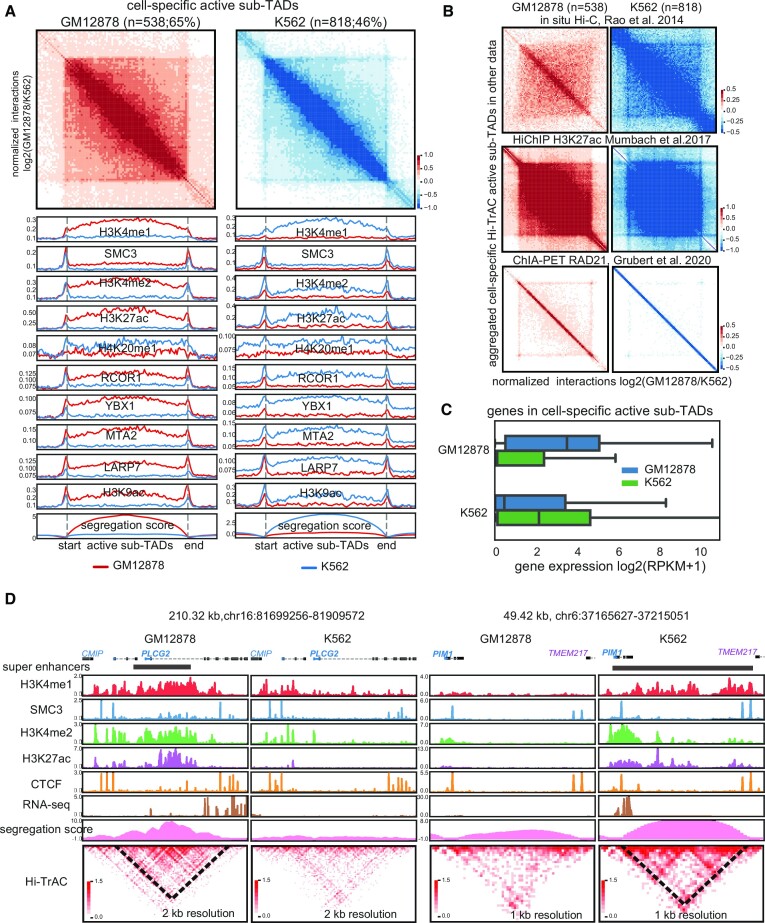
Figure 4.
Hi-TrAC detects cell-specific active sub-TADs. (A) Aggregation analysis of cell-specific active sub-TADs in GM12878 and K562 cells (Supplemental Table 5). Also shown are the top 10 most important features identified from the classification model. (B) Aggregated domain analyses for Hi-TrAC detected cell-specific active sub-TADs using in situ Hi-C (top panel), H3K27ac HiChIP (middle panel), and RAD21 ChIA-PET data (lower panel). (C) Distribution of expression levels for the genes located within the cell-specific sub-TADs identified by Hi-TrAC. The blue box shows the genes of GM12878 cell-specific sub-TADs, and the green box shows that of K562, respectively. (D) Examples of GM12878 and K562 specific active sub-TADs.

