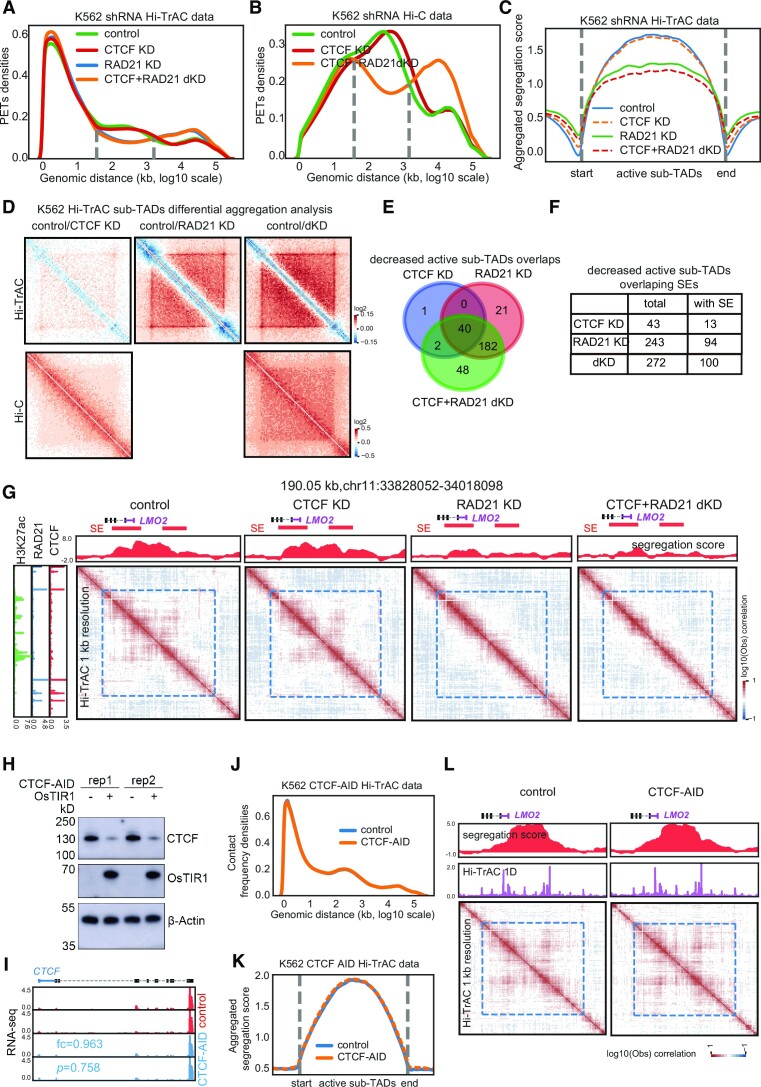
Figure 5.
Active sub-TADs are disrupted by knockdown of RAD21. (A) Distribution of frequencies of interacting PETs against genomic distances of Hi-TrAC data in wild-type and various knockdown K562 cells. KD: knockdown; dKD: double knockdown. (B) Distribution of frequencies of interacting PETs against genomic distances of Hi-C data in wild-type and various knockdown K562 cells. (C) Aggregation analyses of segregations scores of sub-TADs identified from Hi-TrAC data after knocking down CTCF or RAD21 either alone or in combination in K562 cells. (D) Aggregation analyses of interaction matrix of sub-TADs identified from Hi-TrAC data after knocking down CTCF or RAD21 either alone or in combination in K562 cells with Hi-TrAC (upper panel) or Hi-C data (lower panel). (E) Overlaps of significantly changed K562 Hi-TrAC active sub-TADs after knocking down CTCF or RAD21 alone or in combination. (F) Overlaps of significant changed K562 Hi-TrAC active sub-TADs with super-enhancers. (G) Example of disrupted active sub-TADs in K562 by knocking down RAD21 at the LMO2 gene locus. SEs stands for super-enhancers. (H) CTCF protein was rapidly degraded by expression of osTIR1 and auxin treatment in K562 cells as measured by Western blotting. (I) Genome browser images of RNA-seq expression from the control and CTCF-AID K562 cells. Fold change (AID/control) and P-value for CTCF were reported by Cuffdiff (55). CTCF RNA level was not affected by tagging with AID. (J) The frequency distribution of interacting PETs against genomic distances in Hi-TrAC data shows no difference between control and CTCF-depleted cells as the two lines overlap. Two biological replicates, each with three technological replicates of Hi-TrAC PETs (Supplemental Table 4) were combined and down-sampled to 54 million cis unique PETs each for both the control and CTCF-AID cells. (K) The aggregation analysis of the segregation scores of K562 active sub-TADs in control and CTCF-depleted cells showed that the two lines overlapped, and no significant difference was detected. (L) An example of preservation of active sub-TADs at the LMO2 gene locus in the CTCF-depleted cells.

