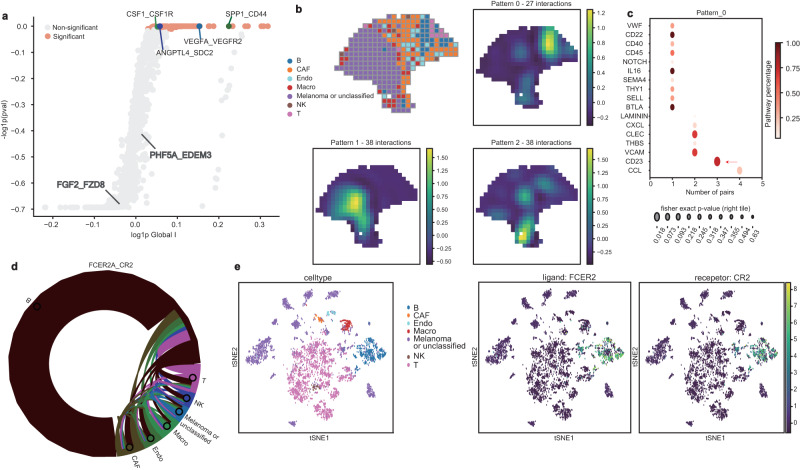
Fig. 2. SpatialDM detects spatially co-expressed LRs in melanoma data and identifies CCC patterns.
a Scatterplot of Global Moran’s R and permutation p-value (one-sided). X-axis is log(Global Moran’s R+1); y-axis is -log(p value+1). Significant pairs (FDR < 0.1) are highlighted in orange. Four well-known positive samples (coloured) and two negative samples (in grey) are highlighted. b Upper left: spatial plot coloured by cell types that have the largest proportion estimated by RCTD. Source data are provided as a Source Data file. Right: Clustering of 103 significant pairs into three spatial patterns by SpatialDE. A representative plot is shown for each spatial pattern. Each plot is coloured by the posterior mean of local statistics in each spatial pattern. c Dot plots of enriched pathways in pattern 0 from panel b. Y-axis: the name of the enriched pathway; x-axis: the number of significant LR pairs in that pathway for each pattern; dot colour: the percentage of significant pairs for that pathway from CellChatDB; dot size: significance of enrichment from One-sided Fisher’s Exact Test (“Methods” section). d Chord diagram summarising cell types interacting for FCER2A_CR2 interaction. Cell types are distinguished by node colours, and edge colours indicate the sender cell types. e tSNE plots of matched melanoma scRNA data, coloured by the original cell types and expression level of ligand FCER2 and receptor CR2, one pair of CD23 ligand-receptor interaction pathway as highlighted in c.

