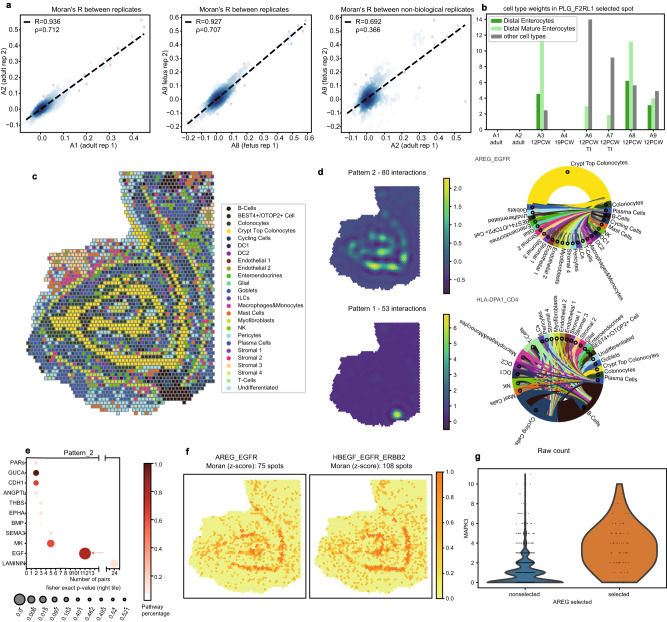
Fig. 3. Multiple intestinal samples for technical validation and CCC pattern discovery.
a Cross-replicate correlations of Global Moran’s R. Pearson coefficients R and Spearman coefficients ρ were specified in the top left. Source data are provided as a Source Data file. (From left to right) Correlations between two adult replicates (A1 and A2), between two foetuses, replicates (A8 and A9), and between an adult and a foetus sample. b Scaled cell type weights of PLG_F2RL1 interacting spots (local z-score p < 0.1, one-sided). PLG_F2RL1 was not identified in adult samples (A1, A2) and 19 PCW colons (A4). Other cell types than enterocytes have been grouped together. c Spatial plot of A1 sample coloured by cell type annotated from the original study. d Summary of pattern 2 and 1 in A1 from SpatialDE. Left: Spatial plots of the pattern. Right: chord diagram for cell type compositions for the selected pairs. Node size indicates the summation of the decomposite cell type weights over selected sender or receiver spots. The edge colour indicates the sender cell type. e Pathway enrichment result for pattern 2 in A1 (one-sided). f Selected local spots of two example pairs under EGF pathways. Colour denotes 1−p. Dot size denotes Fisher’s Test significance. The numbers of significant spots were specified (p < 0.1, one-sided). g Comparison of MAPK3 expression in AREG_EGFR local selected spots (z-score p < 0.1, one-sided) vs. non-selected spots.

