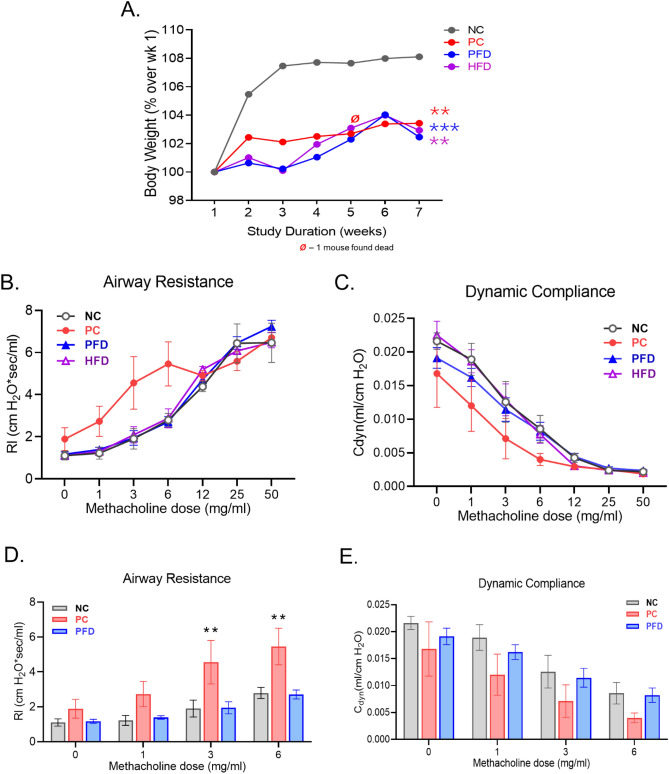
Figure 1.
(A) Changes in the mice body weights in each group during the study shown as the percentage change over average initial body weight for each group. Data shown as mean ± SEM and analyzed by ANOVA (n = 10/gp); **p < 0.01; ***p < 0.001 compared to NC group. Lung function parameters analyzed following CDE-exposure and air filtration in each mice group. The (B) airway resistance (RL) and the (C) dynamic compliance (Cdyn) of anesthetized mice from each group were determined following the increasing dose of methacholine (MCh) (0, 1, 3, 6, 12, 25 and 50 mg/mL) aerosol challenges via inhalation. The histograms showing individual group (D) RL and (E) Cdyn values for mice challenged with 0, 1, 3, and 6 mg/mL of methacholine. Data shown as mean ± SEM (n = 5/gp) and analyzed by 2-way ANOVA; **p < 0.01.

