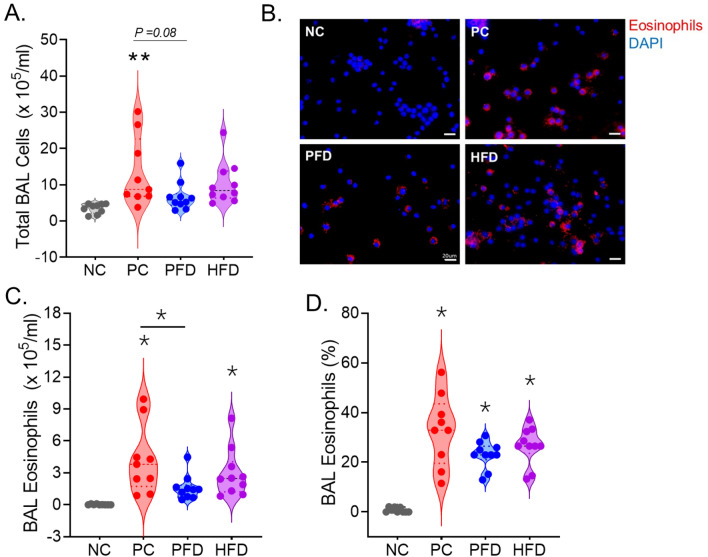
Figure 2.
CDE aerosol induced airway eosinophilia is suppressed by PFD. (A) Violin plot analysis of total BALF cells obtained from each group where each dot represents individual mouse per group. (B) Representative micrographs showing immunostained eosinophils (shown in red) in BALF cytospins for each group with nuclei stained with DAPI (shown in blue), scale bar—10 µm. Quantitation of (C) total eosinophils and (D) eosinophil percentage per ms in each group. Data analyzed by ANOVA (n = 10/gp except for PC, n = 9); *p < 0.05, **p<0.01.

