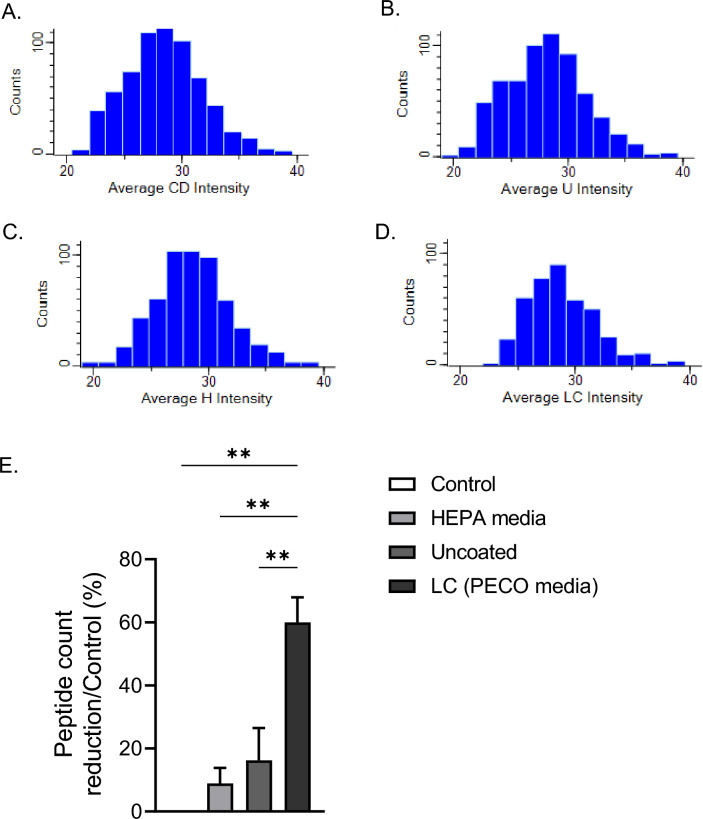
Figure 6.
The PECO 2.0 demonstrated a reduced number of proteins as compared to the uncoated and HEPA filter media swatches contaminated with cat dander extract. Histograms showing the number of proteins (Counts) and their Log2 Intensity values for (A) cat dander/Control, (B) uncoated filter media (U), (C) HEPA media (H), and (D) PECO 2.0 filter media (LC) contaminated with cat dander. (E) The percentage of protein degradation by normalized with control/whole solution of cat dander. Data shown as mean ± SEM and analyzed by ANOVA (n = 3); **p < 0.01.

