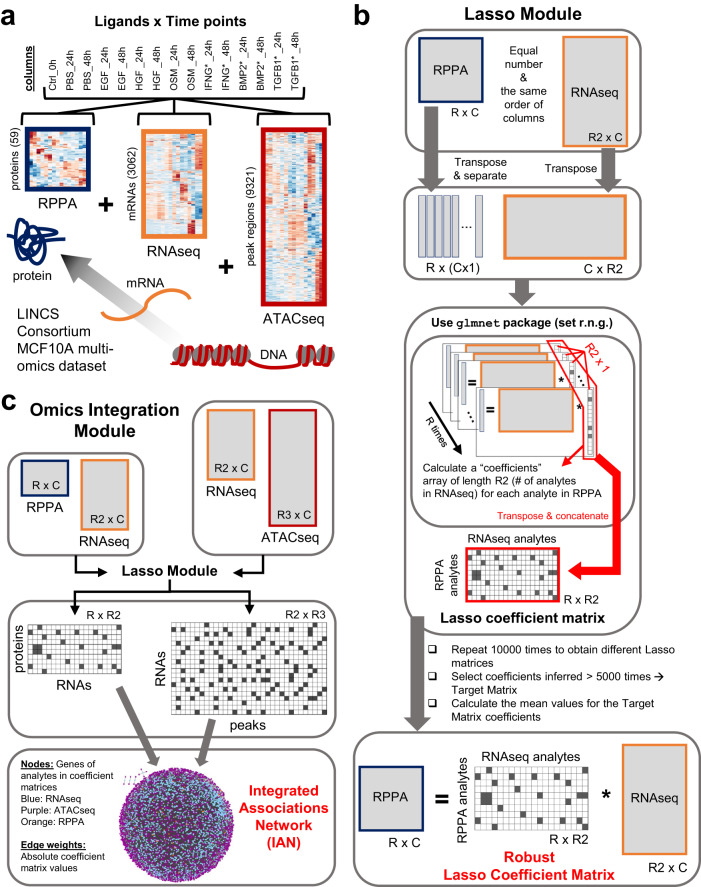
Fig. 2. The MOBILE Integrator pipeline transforms input data into gene-level association networks.
a The LINCS MCF10A datasets include proteomic (RPPA), transcriptomic (RNAseq), and epigenomic (ATACseq) assays. The number of analytes retained after data preprocessing are shown in parentheses on the y-axis. The heatmaps shown are the results from the hierarchical clustering of rows. Source data are provided as a Source Data file. b The Lasso module is used to integrate omics datasets one pair at a time. The associations between chromatin peaks (ATACseq) and mRNA levels (RNAseq) and between mRNA levels and protein levels (RPPA) are calculated separately. The two assay input matrices are structured to yield a Lasso coefficient matrix, which contains association coefficients between analytes of the two input matrices. Ten thousand instances of the Lasso matrices are generated. The coefficients that appear in at least half the matrices (>5000 times) are considered robust and the mean values of these coefficients populate the Robust Lasso Coefficient Matrix (RLCM). The non-zero elements in this matrix are called associations for the remainder of this work. c The Robust Lasso Coefficient Matrices of two input pairs are combined to generate Integrated Association Networks (IANs). These gene-level networks represent robustly, statistical associations inferred from multi-omics datasets, offering a new hypotheses generation tool to look for ligand or gene-set specific sub-networks. Node colors represent; blue:RNAseq, purple:ATACseq, and orange:RPPA, and the edge widths correlate with the magnitude of the association coefficients.

