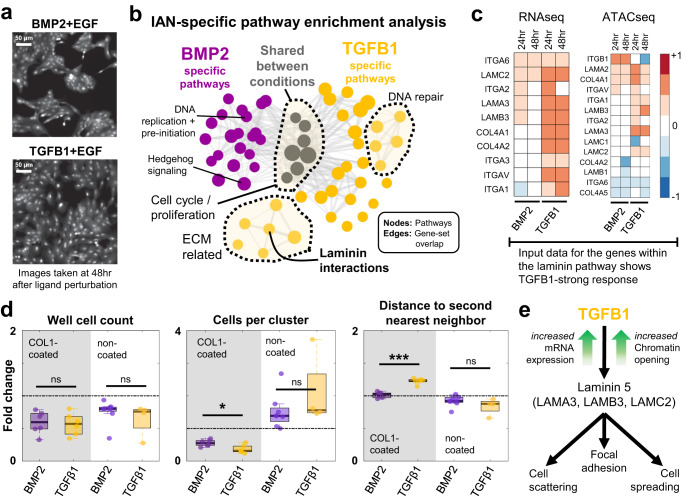
Fig. 6. TGFβ1 and BMP2 induce different morphological phenotypes by differentially activating collagen-laminin signaling.
a TGFβ1 and BMP2 induce phenotypically different responses at 48 h after ligand treatment76. Representative images are adapted examples from eight biological replicates. b Both TGFβ1 and BMP2 networks are enriched in cell cycle and proliferation-related pathways (gray circles). TGFβ1 alone is shown to regulate ECM-related pathways, whereas BMP2 network genes are linked to other membrane receptor-related signaling pathways and cell cycle checkpoints. Node size is proportional to the enrichment scores and edge widths represent the number of overlapping genes. c The expression levels of the laminin pathway genes (left) are upregulated by TGFβ1. The chromosomal regions (peaks, right panel) of the laminin genes are more accessible in the TGFβ1 condition. Transcriptomic and epigenomic data shown are the average values from three independent biological replicates. Source data are provided as Source Data file. d BMP2 (purple) and TGFβ1 (gold) induce similar anti-growth responses but yield different microenvironmental and spatial characteristics. Both ligands inhibit cell proliferation (well cell counts, shaded region). BMP2 induces a larger number of cells in clusters compared to TGFβ1 (cells per cluster, shaded region, p value = 0.0175). TGFβ1 causes cells to spread and have a longer distance to their second nearest neighbors (distance to second neighbors, shaded region, p value = 9.4032E-06). Cells grown in non-collagen-coated regular tissue-culture plates show phenotype reversal of cells per cluster and distance-to-second-neighbor metrics (unshaded regions, middle and right box plots), with no significant cell number differences between BMP2 and TGFβ1. The box edges correspond to the 25th−75th percentiles, the horizontal black lines represent the median, and the dots are individual data points. The whiskers extend to the non-outlier extremes. ns: not significant, asterisk: p value <0.05, three asterisks: p value <0.001. Significance using two-sided Student’s t-test with unequal variance. Data shown are from N = 6, 6, 8, and 4 biological replicates respectively. Source data are provided as Source Data file. e The schematic of TGFβ1 specific regulation of a non-SMAD pathway, inferred by the MOBILE pipeline. TGFβ1 induces laminin pathway gene expression and leads to cell scattering and cell spreading with larger cells, when compared to BMP2 stimulation.

