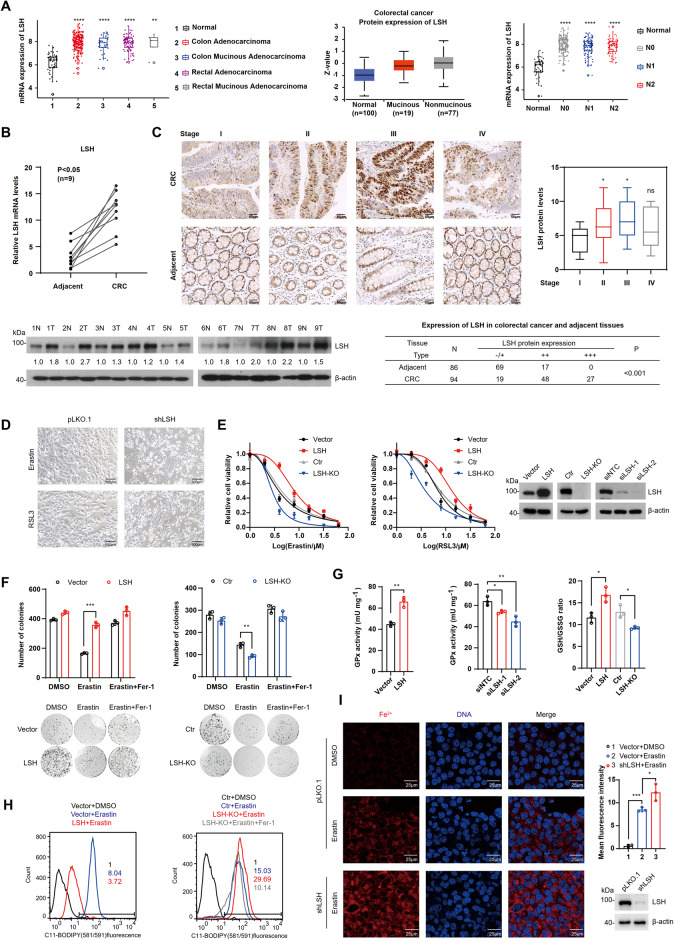
Fig. 1. Upregulation of LSH expression inhibits ferroptosis in CRC.
A Analysis of LSH expression in CRC and normal tissues from TCGA and CPTAC databases (Nx represents the extent of CRC lymph node metastasis). B RT-qPCR (top) and WB (bottom) analyses of LSH expression levels in paired CRC samples. N, adjacent normal tissues; T, CRC tumor tissue (n = 9). C Immunohistochemical analysis of LSH expression in paired CRC samples at different clinical stages. Scale bar: 50 μm. Statistical results are included (right). The P-value was calculated using the χ2 test (bottom). D Representative images showing cell death. SW620 cells were treated with erastin (20 μM) or RSL3 (20 μM) for 24 h. Scale bar, 500 μm. E HCT116 cells overexpressing or depleted of LSH were treated with different concentrations of erastin or RSL3 for 24 h, and cell viability was assayed. Values are presented as mean ± SD (n = 3). F Clonal expansion analysis of HCT116 cells overexpressing or depleted of LSH. The cells were incubated with erastin (20 µM) for 24 h or Fer-1 (5 µM) for 20 h. Values are presented as mean ± SD (n = 3). G Intracellular GPx activity and GSH and GSSG levels were measured in LSH overexpressing or LSH-deficient HCT116 cells. Values are presented as mean ± SD (n = 3). H Analysis of lipid peroxidation in LSH overexpressing or LSH-deficient cells treated with erastin (20 μM) for 24 h or Fer-1 (5 μM) for 20 h. I Intracellular Fe2+ levels were examined in cells incubated with DMSO or erastin (20 µM) for 24 h using laser scanning confocal microscopy with FerrOrange staining. Scale bar, 25 µm.

